
The Difference Between “Works” and Compounds
Cutting funding is often the difference between a strategy that “works” and an account that actually compounds.
A few dollars here. A fraction of a percent there. Over dozens or hundreds of trades, it compounds into something large enough to reshape your results.
If you trade crypto futures long enough, you have probably felt this at some point. Your execution feels solid. Your entries make sense. Your losers are controlled. Yet when you zoom out to a month or two, the equity curve looks flatter than it should. Sometimes it even drifts lower despite what felt like a decent stretch of trading.
Funding rates are often the reason.
Most traders know funding exists, but very few actually feel its impact until it has already done damage. That is because funding does not hit you like a bad stop or a slippage spike. It comes quietly.
In fast intraday trading, it is easy to dismiss funding as background noise. Your attention is on entries, exits, liquidity, and volatility. Funding feels like a technical detail that matters more for swing traders or position traders. In reality, even small holding times add up when positions are sized aggressively and leverage is involved.
Crypto futures make this worse because of how active the market is. There is always a setup. There is always another position open. Many traders spend more time in trades than they realize. Funding becomes a constant tax on exposure, not an occasional fee.
The dangerous part is that funding does not show up in your thinking the same way bad execution does. You do not blame yourself for it. You do not feel urgency to fix it. You just notice that your “good” trading is not producing the growth it should. That is the silent leak.

Building a Real Model of Funding Costs
Funding hurts because it attacks your expectancy in a way most traders never model. You think in terms of win rate, average R, and drawdown. Funding operates underneath all of that. It is not a trade outcome. It is a constant cost applied to exposure itself.
Commissions are paid once when you enter and once when you exit. Slippage is tied to specific execution mistakes or market conditions. Funding is different. It accumulates as long as your position exists. The longer you stay in a trade, the more it compounds against you. That means funding is not just a fee. It is a timer running against your position.
If your strategy relies on holding winners longer than losers, funding eats directly into your strongest edge. The trades that should contribute most to your expectancy become the ones paying the highest cost. That alone can flip a marginally profitable strategy into a breakeven one.
Short-term performance can mislead crypto traders. In volatile conditions, price movement overwhelms funding. A strong directional move makes funding feel irrelevant. You can make ten times the funding cost in minutes. That creates a false sense of safety. You assume funding is something to worry about later. Over weeks and months, the relationship reverses. The large wins are rare. The funding payments are constant.
Psychology makes the problem stick. Funding does not feel like a mistake. You do not feel the same emotional response as you do after chasing a breakout or cutting a winner too early. Because it is passive, you treat it as unavoidable. That makes it easy to ignore even when it becomes one of your largest cost centers.

Leverage amplifies this. A small funding rate applied to a large leveraged position becomes meaningful very quickly. A trader risking one percent per trade but holding high notional exposure overnight is paying far more than they realize. They are effectively transferring edge to the market just for being in a position.
Crypto’s 24/7 structure makes this worse. There is no natural session close. There is no forced flattening. Positions stay open through low-liquidity hours, funding resets, and weekend conditions. Many traders unintentionally become swing traders without ever planning to, and funding punishes that drift.
The foundation issue is not that funding exists. It is that most traders never integrate it into how they evaluate performance. They judge strategies based on gross PnL and R-multiples while funding quietly erodes the net result. When the gap between the two grows large enough, confusion sets in. The strategy “works,” but the account does not grow.
Turning Strategy Stats Into Net Reality
Most traders evaluate strategies using a handful of core numbers. Win rate. Average R. Expectancy. Maximum drawdown. All of these are useful, but only if the data reflects the true cost of holding positions. Funding breaks that assumption when it is not modeled correctly.
Imagine a simple intraday strategy that wins 52 percent of the time with an average reward of 1.2R and an average loss of 1R. On paper, this is a solid edge. Over a large sample, it should grow an account steadily. Many traders stop their analysis there and feel confident in the system.
Now layer funding on top of it.
If your average winning trade is held longer than your average losing trade, funding reduces the reward side of the equation more than the risk side. Your 1.2R winners might become 1.05R after funding. Your 1R losers might become 1.02R. That does not look dramatic on a single trade. Over hundreds of trades, it completely changes expectancy.
What looked like a positive edge turns into something fragile or even negative.
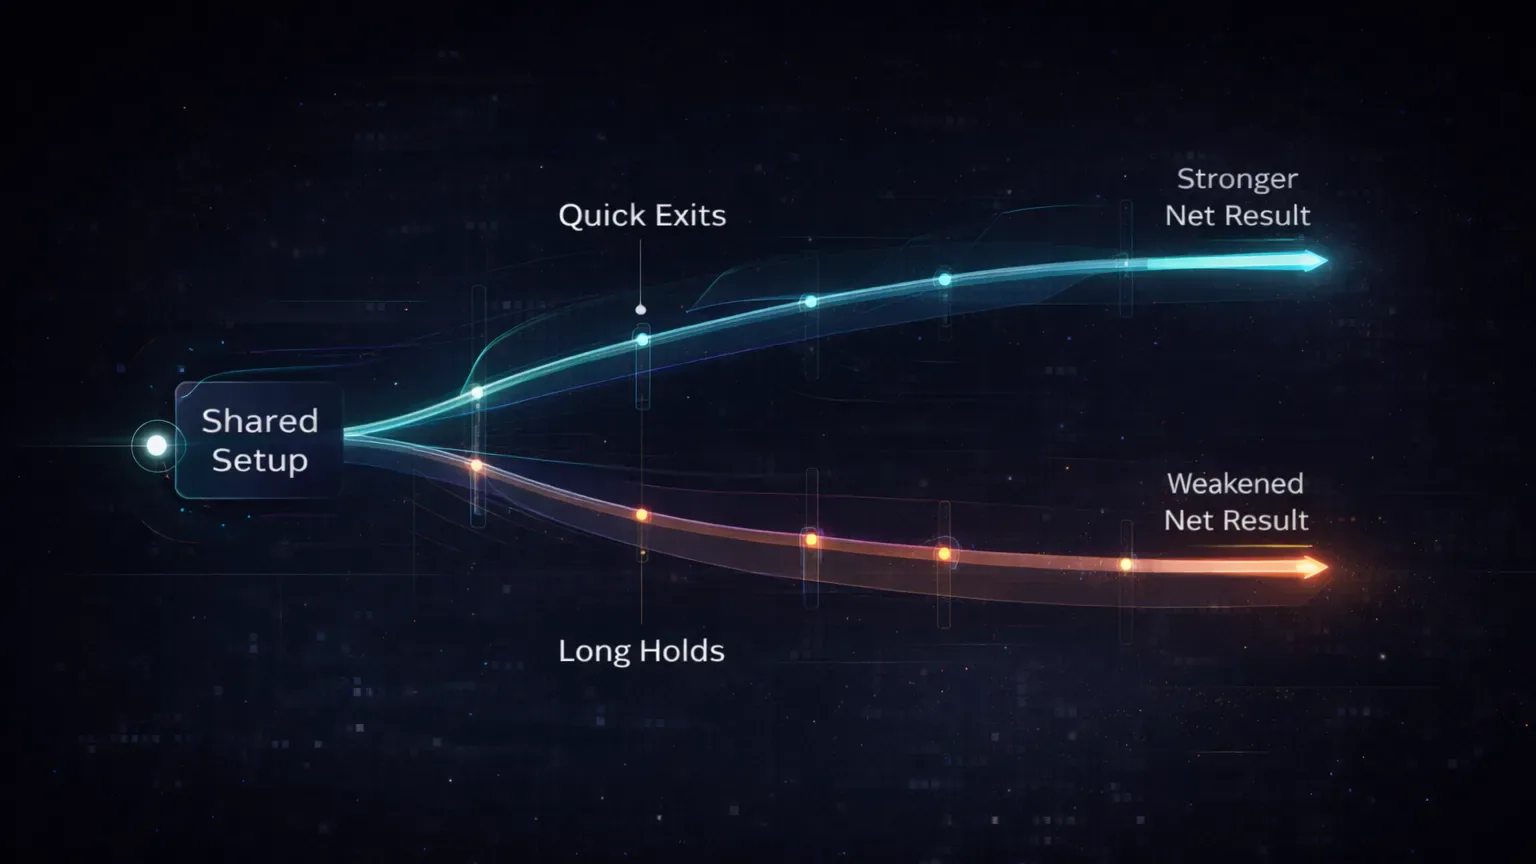
Two traders can trade the same setup and get radically different results. One closes positions quickly. The other holds longer, especially when in profit. The second trader pays far more in funding. Their strategy statistics may look identical before costs, but their equity curves diverge over time.
Funding also distorts backtesting. Many crypto backtests ignore funding or assume it is negligible. That makes strategies appear far more robust than they are in live trading. When a trader deploys them, they feel betrayed by their own data. The issue is not the strategy. It is the missing variable.
R-multiple analysis becomes unreliable when funding is not included. You start believing your average R is higher than it truly is. You believe your edge is stronger than it is. That leads to overconfidence in position sizing and risk exposure. The drawdowns that follow feel random, but they are mathematically predictable once funding is accounted for.
Reporting can hide the real driver. If your journal tracks PnL before funding and after funding separately, many traders only look at the first number. They review trades, improve execution, and celebrate cleaner entries while the real cost driver remains untouched. The more professional your execution becomes, the more obvious funding’s impact grows.
What actually happens is uncomfortable. As you reduce mistakes, funding becomes a larger percentage of your total cost structure. At that point, ignoring it is no longer a small oversight. It is a strategic blind spot.
Learning From a Real Week of Funding Bleed
One of the clearest examples of funding changing a trader’s results comes from a futures trader on OKX who traded SOL and ETH perps almost every day. His execution was clean. His win rate hovered around 55 percent. His losers were tight. On individual sessions, he often finished green. Yet his monthly performance barely moved.
When he finally broke his PnL down properly, the pattern was obvious. Funding was eating a meaningful part of his edge.
He had a habit most profitable scalpers develop. When a trade went his way, he gave it room. He let it run. When a trade went against him, he cut it quickly. From a pure price-action perspective, this made sense. From a funding perspective, it was quietly destructive. His winners were paying two or three funding intervals. His losers were paying almost none.
At first, the numbers felt insignificant. A few dollars per trade. Ten dollars here. Fifteen there. But when he summed funding by week, it shocked him. Some weeks, funding was equal to 20 to 30 percent of his gross profits. That meant his “edge” was already thinner than he believed. He was trading on a much smaller margin of error than his stats suggested.
He made two changes.
First, he added funding as a visible metric in his reviews. Every weekly session included total funding paid, funding by symbol, and funding by holding time bucket.
Second, he adjusted how he managed winners. Instead of letting profitable positions drift through multiple funding resets, he became more intentional. Partial exits before funding windows. Tighter rules for overnight holds. A clearer separation between scalps and true swings.
The strategy itself did not change. The entries did not change. The setups did not change. Only the exposure timing did.
Within a month, his net PnL stabilized. The equity curve stopped stalling. He was not trading better. He was paying less for the same edge.
Making Funding Visible Inside Your Journal
Funding only becomes manageable once it becomes visible. If your journal treats funding as a footnote or hides it inside a final balance number, you will never develop intuition for how much it is costing you. It needs to sit next to the same metrics you already respect: PnL, R-multiple, win rate, and drawdown.
The first shift is mental. Funding is not an exchange detail. It is part of trade performance. A trade that makes 50 dollars and pays 12 dollars in funding is not a 50-dollar winner. It is a 38-dollar winner. That difference matters when you repeat it hundreds of times.
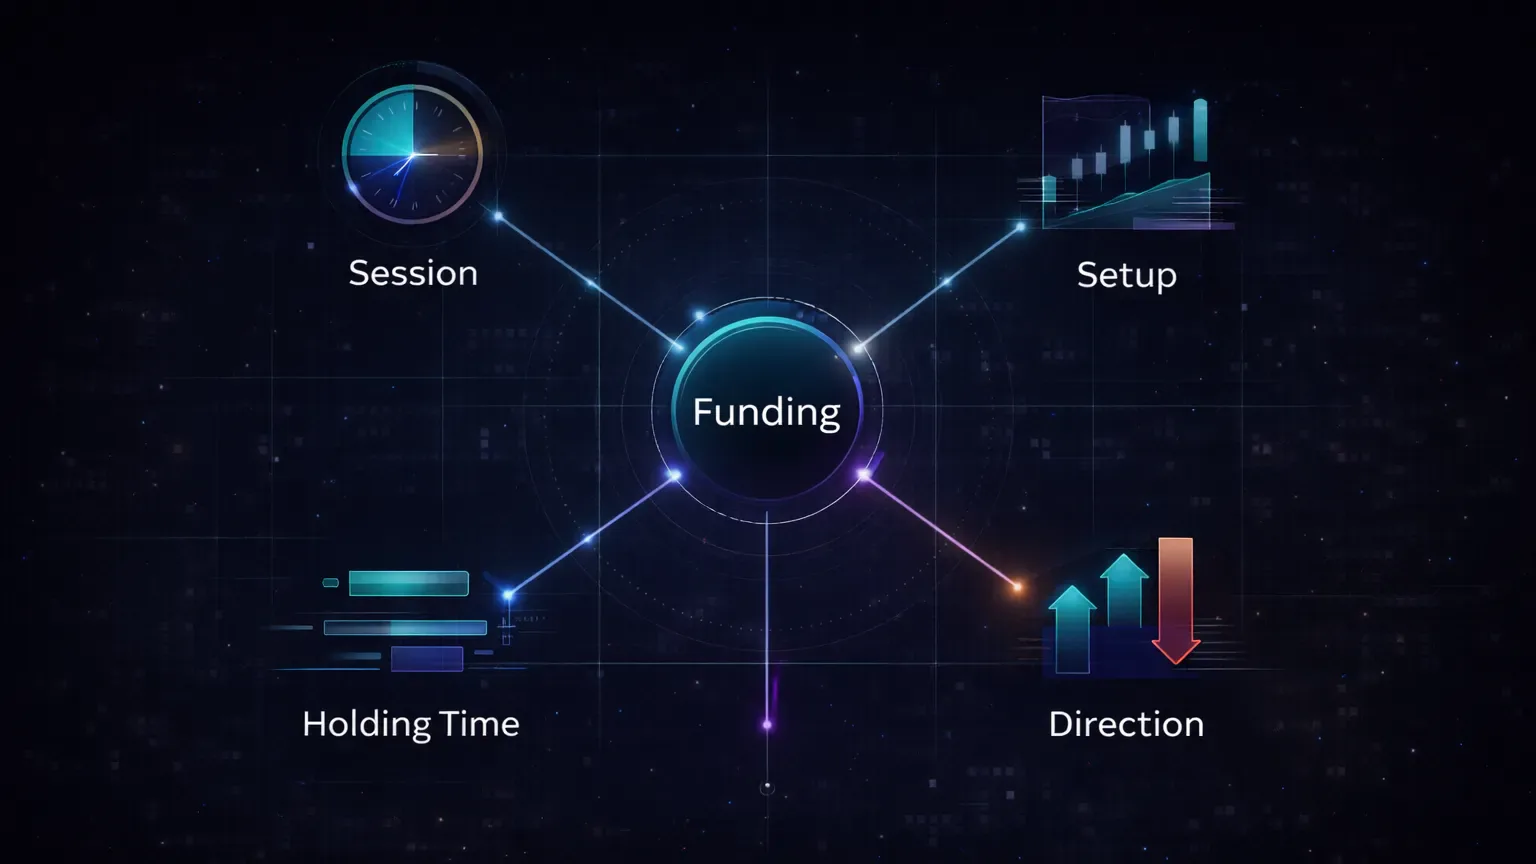
In a serious journal, funding should be analyzable across dimensions:
By session.
Some sessions naturally produce longer holds. Asia hours, weekend trading, and slow trend days tend to stretch trade duration. If funding is higher during those periods, your session profitability is not just about execution quality. It is about cost structure.
By strategy or setup.
Certain setups encourage patience. Breakout holds, trend continuation trades, and higher timeframe entries all push holding time upward. If funding is not attached to these strategies in your reports, you are misjudging their true expectancy.
By holding time.
This is one of the most revealing cuts of the data. When you bucket trades by duration, funding patterns jump out immediately. Short scalps often look almost free. Trades held through one or more funding windows suddenly show a dramatic drop in net R.
By direction.
In many market conditions, one side pays consistently more funding than the other. If you are structurally biased long or short, funding becomes directional drag. Your market bias quietly becomes a cost problem.
Journaling tools change how fast you learn. If funding is imported automatically with each trade, you stop guessing. You stop approximating. You stop assuming. You see exact numbers tied to real positions. In a platform like TradeChainly, funding lives next to your execution stats instead of being buried in an exchange statement. That changes how quickly patterns emerge.
The key metric is net PnL after funding. That must become your default lens. Gross PnL is useful for studying execution. Net PnL is what determines whether your trading career compounds or stalls. When the two diverge meaningfully, funding is often the reason.
Spotting the Funding Clusters Worth Fixing
Once funding is visible in your journal, it stops being an abstract cost and starts behaving like a pattern. Just like entries and exits develop tendencies, funding develops its own structure. The traders who control it best are not the ones who avoid funding completely. They are the ones who recognize where it concentrates and why.
Weekend funding bleed is a classic. Liquidity drops. Volatility becomes less reliable. Positions stay open longer because price drifts instead of moves. At the same time, funding rates often become more extreme as positioning imbalances build. Traders who hold exposure through multiple weekend funding windows frequently see their best trades slowly decay. The chart looks fine. The PnL shrinks anyway.
Directional bias is another. In strong bull phases, long positions usually pay funding. In heavy downtrends, shorts pay. If your trading style is structurally biased in one direction, funding becomes a tax on your worldview. You may be “right” on market structure and still underperform because you are always on the expensive side of positioning.
Plenty of crypto traders misread their results here. They think their bias is not working anymore. In reality, their bias still works, but funding absorbs part of the edge. Without separating directional performance from funding cost, the analysis becomes emotionally confusing and technically wrong.
Holding time is another major driver. When you sort trades by duration, the picture becomes brutal. Trades under 15 minutes often show almost no funding impact. Trades held for several hours show measurable erosion. Trades held through one or more funding resets show a sharp drop in net R.
This reveals whether you are actually a scalper or a disguised swing trader. Many traders identify as short-term, but their data shows a significant portion of capital tied up long enough to pay real funding.

A mistake pattern also shows up in losing trades. Some traders cut losers quickly but hesitate to close winners because “it might go further.” Those winners end up becoming long holds that barely move, slowly paying funding until the edge disappears. What should have been efficient profits turn into breakeven grinds.
Symbol selection matters too. Highly crowded contracts, meme coins, and trending majors often carry persistent funding pressure. If one or two symbols dominate your trading, they may dominate your funding cost too. That is not a coincidence. It is structural.
These patterns matter because they are controllable. Funding is not random. It concentrates in specific behaviors: holding too long, trading biased, trading thin liquidity periods, and staying in crowded contracts. Once you see those clusters, you stop thinking about funding as an unavoidable cost and start treating it like any other execution flaw that can be optimized.
Reducing Funding Drag Without Changing Your Edge
Most traders assume that controlling funding means changing how they trade. New setups. Shorter timeframes. Different markets. In practice, the biggest improvements usually come from small execution adjustments that reduce exposure time without touching the edge itself.
Timing is the simplest lever. Funding windows are known in advance. If a position is already deep in profit and momentum is slowing, holding it through a funding reset rarely makes sense. You are paying for hope at that point. Closing or partially reducing before funding does not weaken your strategy. It just protects the profit you already earned.
Partial exits are another underused tool. If your setup is designed to let winners run, you do not need full exposure for the entire duration. Reducing size after the first impulse move keeps you aligned with the trend while cutting the funding cost dramatically. You still participate if the market extends, but you stop paying full price for patience.
Exchange selection matters more than most traders realize. Funding rates differ across Binance, Bybit, OKX, Coinbase, and others. Sometimes the difference is small. Sometimes it is significant enough to change net expectancy. If you trade the same contract on different venues, your funding cost profile can change even when your execution stays identical. That is not optimization. That is basic cost control.
Session selection also plays a role. During high-liquidity hours, price tends to resolve faster. Trades reach targets or invalidate sooner. During slow sessions, positions drift. Drift increases funding exposure. If you notice that certain trading windows consistently produce higher funding per unit of profit, that is a structural inefficiency worth addressing.
Mindset matters here too. A trade that has done its job is complete. It does not need to become a long-term investment just because the chart still looks acceptable. Funding punishes indecision more than bad entries. When you respect that, your exit discipline sharpens naturally.
The important point is this: you do not need to avoid funding. You need to stop donating edge to it. Most funding drag comes from a handful of repeatable behaviors. Fix those, and your strategy improves without changing a single setup rule.
Turning Funding Awareness Into a Weekly Habit
Seeing funding once is not enough. The real shift happens when it becomes part of your regular review process. Just like you track win rate or average R, funding needs to be something your brain expects to see every time you analyze performance.
A simple weekly review is enough to build that awareness. Start with three numbers:
- Total funding paid for the week
- Funding as a percentage of gross PnL
- Net PnL after funding
Those alone already change how you interpret results. A green week with high funding suddenly feels fragile. A small green week with low funding starts to feel efficient. You stop looking only at outcomes and start looking at quality of exposure.
Next comes classification. Funding-heavy trades deserve their own tag or note. Not because they are “bad,” but because they reveal where your time-in-market is leaking value. A trade that paid unusually high funding should prompt one simple question: was that exposure necessary?
A trading journal becomes more than a record at this point. It becomes a feedback loop. When funding is automatically imported and visible per trade, patterns surface without manual effort. You can sort by highest funding paid. You can group by symbol. You can filter by holding time. In a tool like TradeChainly, this happens naturally because funding lives next to every position, not hidden in an exchange statement.

A practical review loop might look like this:
- Scan weekly funding totals
- Identify top 5 funding-heavy trades
- Check what they have in common
- Add a note explaining why the position was held
- Decide whether that behavior makes sense going forward
Over time, this builds intuition. You start anticipating funding while you are in a trade, not after. You feel the cost of patience. You weigh the benefit of staying versus the certainty of paying.
That is the moment funding stops being a technical detail and becomes part of your trading skill. It shapes how you size, how you exit, and how you structure exposure. Not because you are afraid of it, but because you finally respect what it represents: the price of being in the market.
Closing the Leak Before It Compounds
Funding is not an external cost that sits outside your strategy. It is part of the strategy, whether you acknowledge it or not. Every minute you stay in a position, you are making a decision about exposure, and funding is the price of that decision.
Most traders lose to funding not because it is large, but because it is invisible. They optimize entries, refine exits, and clean up execution while leaving a constant leak untouched. Over time, that leak becomes big enough to flatten an otherwise solid equity curve. The strategy still works. The results just stop compounding.
Once you start tracking funding properly, the narrative changes. You see where your edge is strongest. You see where patience is productive and where it is expensive. You stop guessing whether a trade was worth holding and start knowing. That clarity alone often adds more to performance than another indicator or setup tweak.
A crypto-first journal matters here. When funding is captured automatically and displayed next to every trade, it becomes impossible to ignore and easy to learn from. TradeChainly was built around that reality. It treats funding as performance data, not as an accounting detail. That makes it far easier to turn awareness into consistent improvement.
Funding will always exist in crypto futures. Ignore it, and it will keep charging you in the background. Track it, and you get to decide when the cost is worth paying.