Why Crypto Traders Need a Real Trading Journal
Most crypto traders learn this lesson the hard way. You can have a strong setup, you can understand technicals, and you can even be profitable for a while. But without a structured way to review your trading decisions, it becomes almost impossible to stay consistent. Crypto markets never sleep. Price moves fast. Leverage magnifies every mistake. If you rely on memory, you only remember fragments of what happened, and even those memories are usually biased.
A lot of traders try to solve this with spreadsheets. That works for a few days. Maybe a few weeks if you have strong discipline. But eventually the manual entries become a chore. You start skipping days. You fall behind. Before long, the journal is abandoned and you're back to emotional, reactive trading.
Then there are generic trading journals that try to cover stocks, forex, options, and crypto in one product. The problem is simple. Crypto day trading is different. Perpetual futures, funding rates, 24/7 volatility, and high frequency execution require tools that are built specifically for this environment. If your journal does not reflect how you actually trade, you simply will not use it.
That is exactly why TradeChainly exists. TradeChainly is a crypto-only trading journal built for day traders and scalpers. It automatically imports your trades from exchanges like Binance, Bybit, Coinbase, Kraken, KuCoin, Crypto.com, and OKX. You do not need spreadsheets. You do not need to copy and paste trade fills. Everything is synced, structured, and ready for analysis.
This blog is not a generic guide about journaling. It is a complete product walkthrough that shows you how to use TradeChainly as your daily performance companion. We will break down the dashboard, daily journal, trades table, trade details view, tags, notebook, reports, and forecasting tools. By the end, you will see exactly how TradeChainly fits into your trading workflow and how you can use it to improve decision making, discipline, and long term results.
Read this like a coach sitting beside you, showing you how to review your trading day properly. The goal is simple. Trade better. Think clearly. Remove unnecessary friction. And finally get a trading journal that actually works for crypto traders like you.
What Is TradeChainly? A Crypto-First Trading Journal
TradeChainly is a trading journal built specifically for crypto day traders and scalpers. That means the entire platform is designed around the reality of crypto markets. Twenty-four hour trading. High volatility. Leverage. Rapid execution. Multiple exchanges. Frequent entries and exits. All of that is normal in crypto, and TradeChainly is built to support it without forcing you to hack together manual systems or spreadsheets.
At its core, TradeChainly is a centralized place where all your crypto trading activity is stored, organized, and transformed into real insights. When you connect your exchange accounts, your trades are automatically imported. That includes Binance, Bybit, Coinbase, Kraken, KuCoin, Crypto.com, and OKX. You can also upload CSV files or enter trades manually if needed. Once your trades are in TradeChainly, the platform calculates performance metrics, builds analytics dashboards, and allows you to review every trade in detail.
The goal is simple. You should spend your time trading and improving, not logging data. TradeChainly removes the friction from journaling by doing the heavy lifting for you. The platform tracks net P&L, gross P&L, fees, volume, win rate, profit factor, expectancy, R-multiples, and much more. You do not need to calculate anything. You simply log in and your performance story is already there.
Unlike generic journals that try to support stocks, options, forex, and crypto in one tool, TradeChainly is crypto-only by design. That matters. Crypto traders use leverage differently. They scale positions. They trade perpetual contracts. They manage funding rates. They often take multiple trades per day. A crypto trading journal needs to handle high-frequency execution and still keep the review process simple and clean. TradeChainly is built around those needs.
The platform also supports structured review workflows. You can analyze trades by day, by tag, by symbol, by timeframe, or by account. You can review specific setups or mistakes. You can give trades ratings. You can mark trades as reviewed. You can attach screenshots and notes. Everything about the platform is focused on helping you learn from your trading activity so you can refine your edge over time.
Think of TradeChainly as your trading performance hub. You trade on Binance or Bybit or another exchange. TradeChainly becomes the system that organizes your history, highlights what is working, exposes what is not working, and supports disciplined review habits. If your goal is consistency and data-driven improvement, this is the type of tool you want supporting your process.
Automatic Trade Syncing: The Foundation of Your Journal
Before you can review your trades, you need your trades inside the journal. This is where most traders give up with traditional journaling tools. If you have to copy and paste every order fill, or type in execution data manually, you will eventually stop. The friction is just too high, especially when you are trading active crypto markets where dozens of trades can happen in a single session.
TradeChainly solves that by giving you automatic trade syncing. You connect your exchange once, and the platform continuously imports your trades in the background. Supported exchanges include Binance, Bybit, Coinbase, Kraken, KuCoin, Crypto.com, and OKX. You choose the account, the market type such as spot or futures, the sync start date, and then enter your API key and secret. Once the connection is created, your trades begin syncing without any further effort from you.
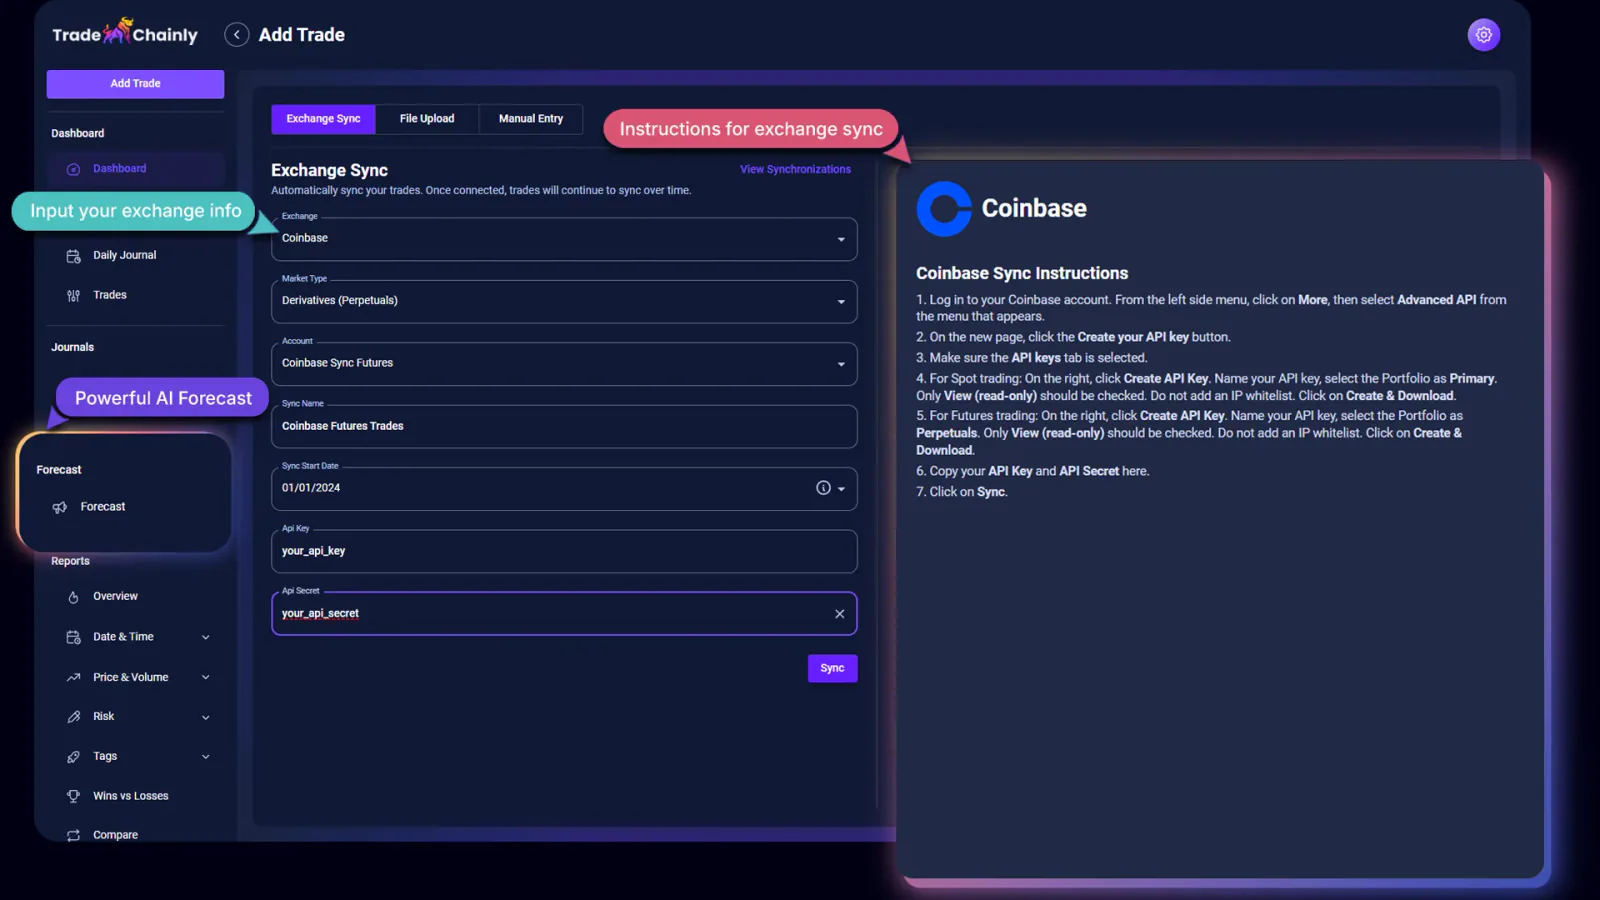
From that point forward, TradeChainly pulls in your executions automatically. You do not have to upload spreadsheets. You do not have to remember to log trades. You can simply trade as normal, and then open TradeChainly later to review the results. This matters because your journal should fit into your workflow, not the other way around. If you make journaling hard, you will not stay consistent.
There are still situations where automatic syncing may not be the method you want to use. Maybe you traded on an exchange that is not yet supported. Maybe you want to upload historical data from older trades. TradeChainly supports CSV uploads as well. And if you want the ultimate control, you can also create trades manually. The point is flexibility. You get multiple ways to bring data in, but automation is the default.
Think about what this enables. A trader scalping Bitcoin perpetuals on Bybit could take 15 trades in a morning. Those trades are synced into TradeChainly while they continue trading. Later in the day, that trader can open the Daily Journal and Trade Details pages and immediately review entries, exits, P&L, fees, performance by symbol, tags, and much more. No data entry. No copy-paste. Just pure review.
If you have ever tried to manually track hundreds or thousands of trades, you already know how time consuming and error prone it becomes. TradeChainly removes that bottleneck completely. Your journal becomes a living system that mirrors your trading activity across multiple exchanges and accounts. That creates the foundation for accurate analytics and honest self-review, which is exactly what serious crypto traders need.
Dashboard: Your Crypto Performance Command Center
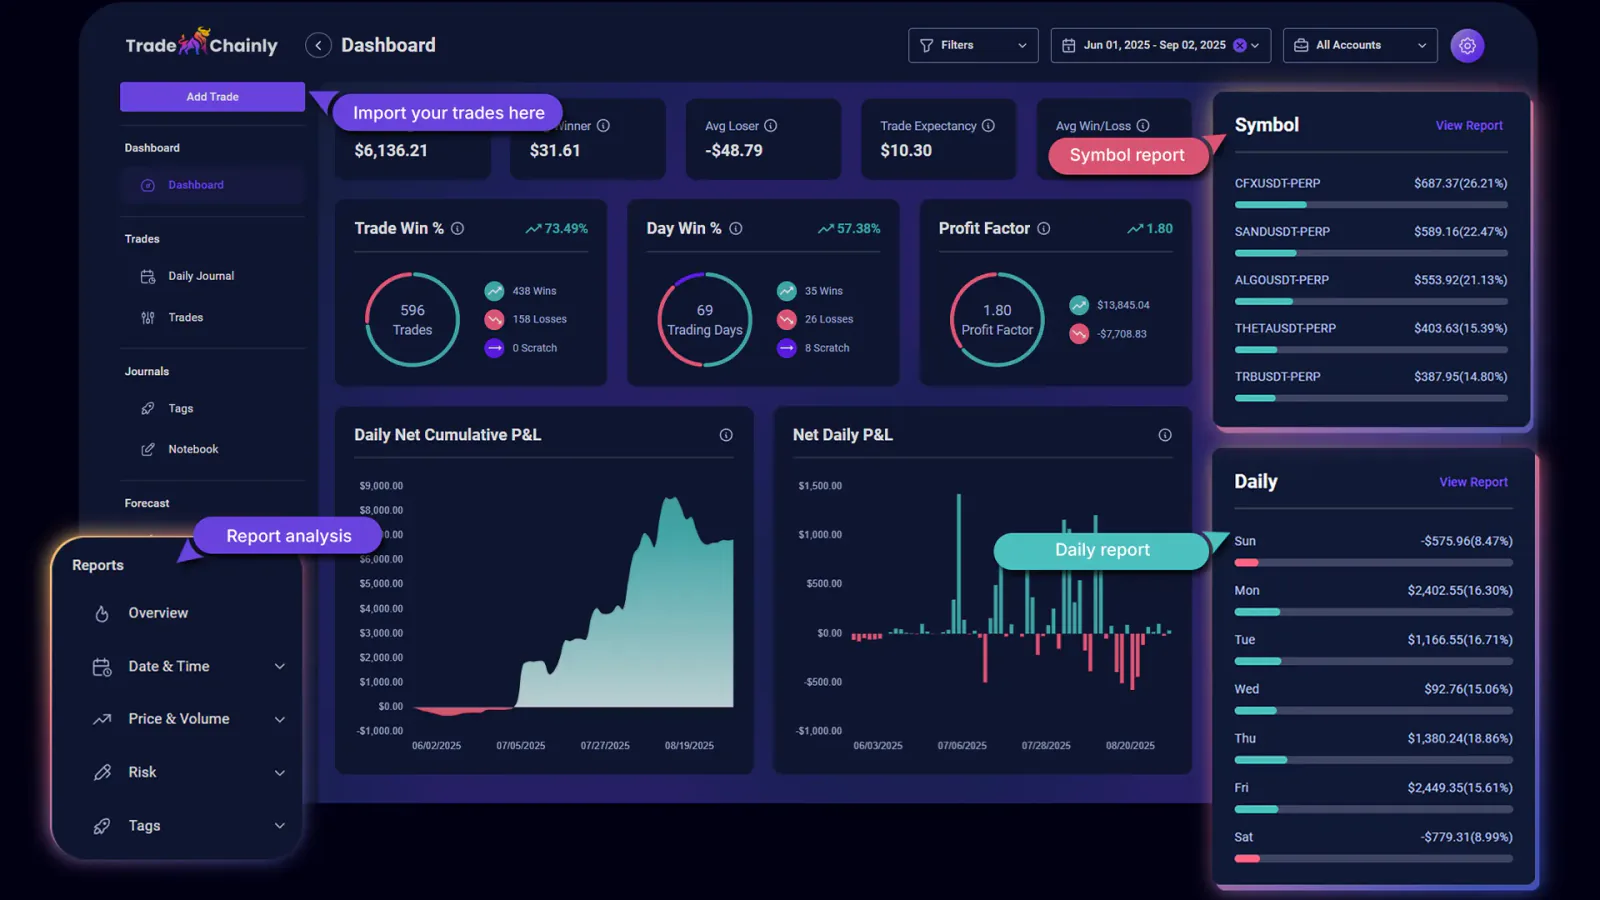
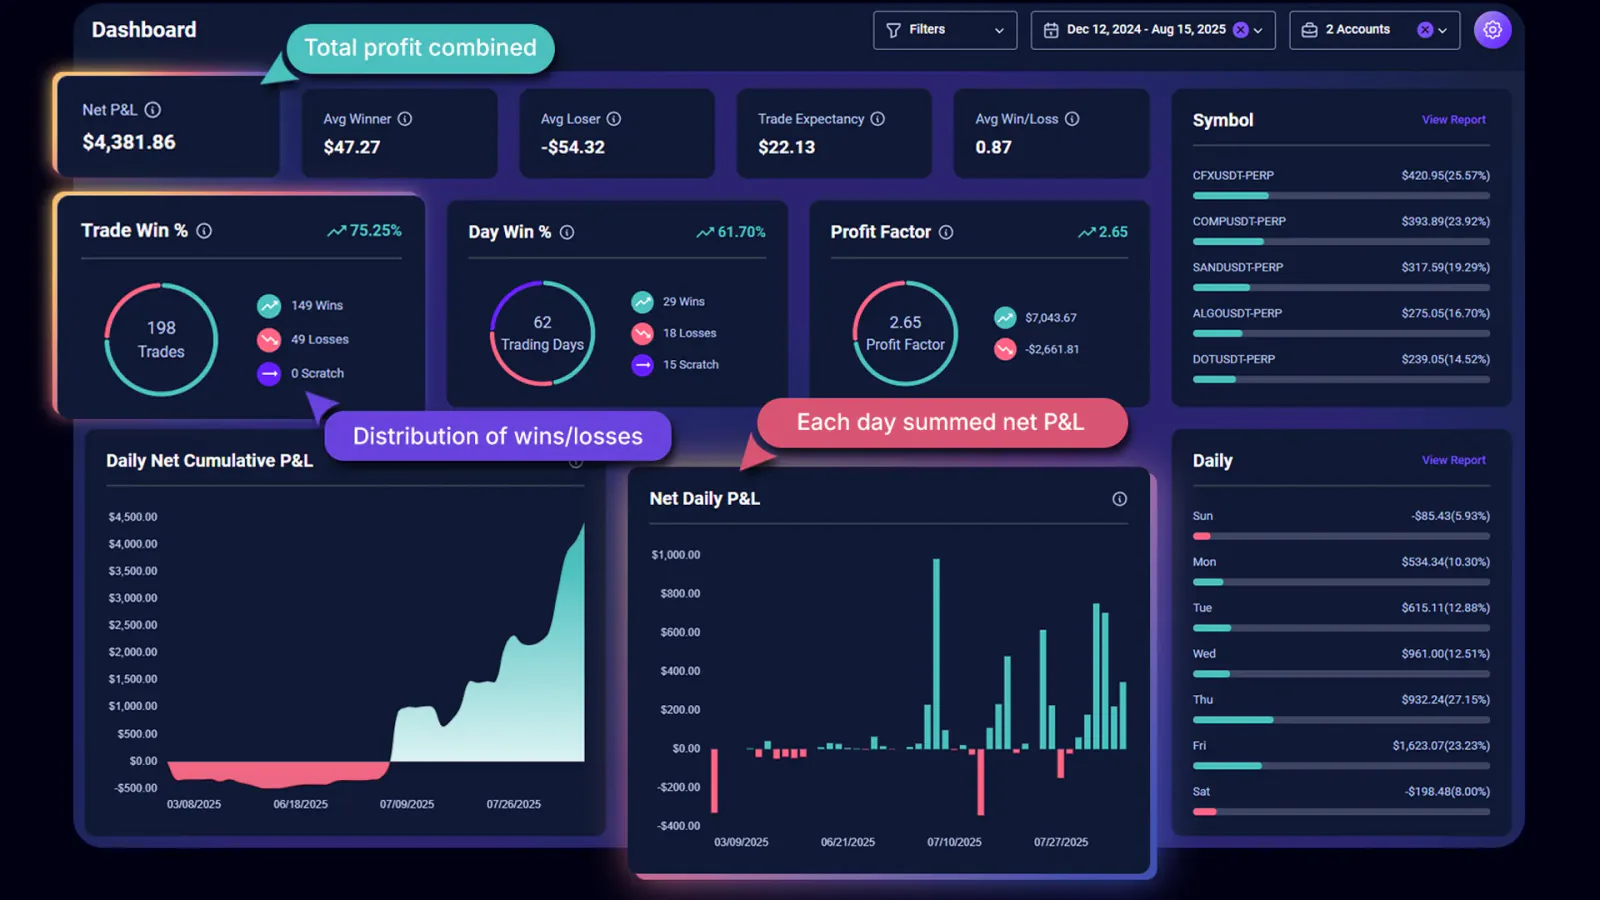
Once your trades are syncing into TradeChainly, the first page that really shows you the bigger picture is the Dashboard. Think of this as your trading performance command center. Instead of scattered screenshots, random notes, or half-finished spreadsheets, you get a clean overview of how you are actually performing in the market.
When you open the Dashboard, you immediately see key performance metrics that every crypto day trader should understand. Net P&L shows your realized profit or loss after fees. Average winner shows the average profit from your winning trades. Average loser shows the average loss from your losing trades. Trade expectancy tells you, on average, what you expect to gain or lose per trade based on your history. These are numbers most traders never calculate, yet they determine whether your system is sustainable.
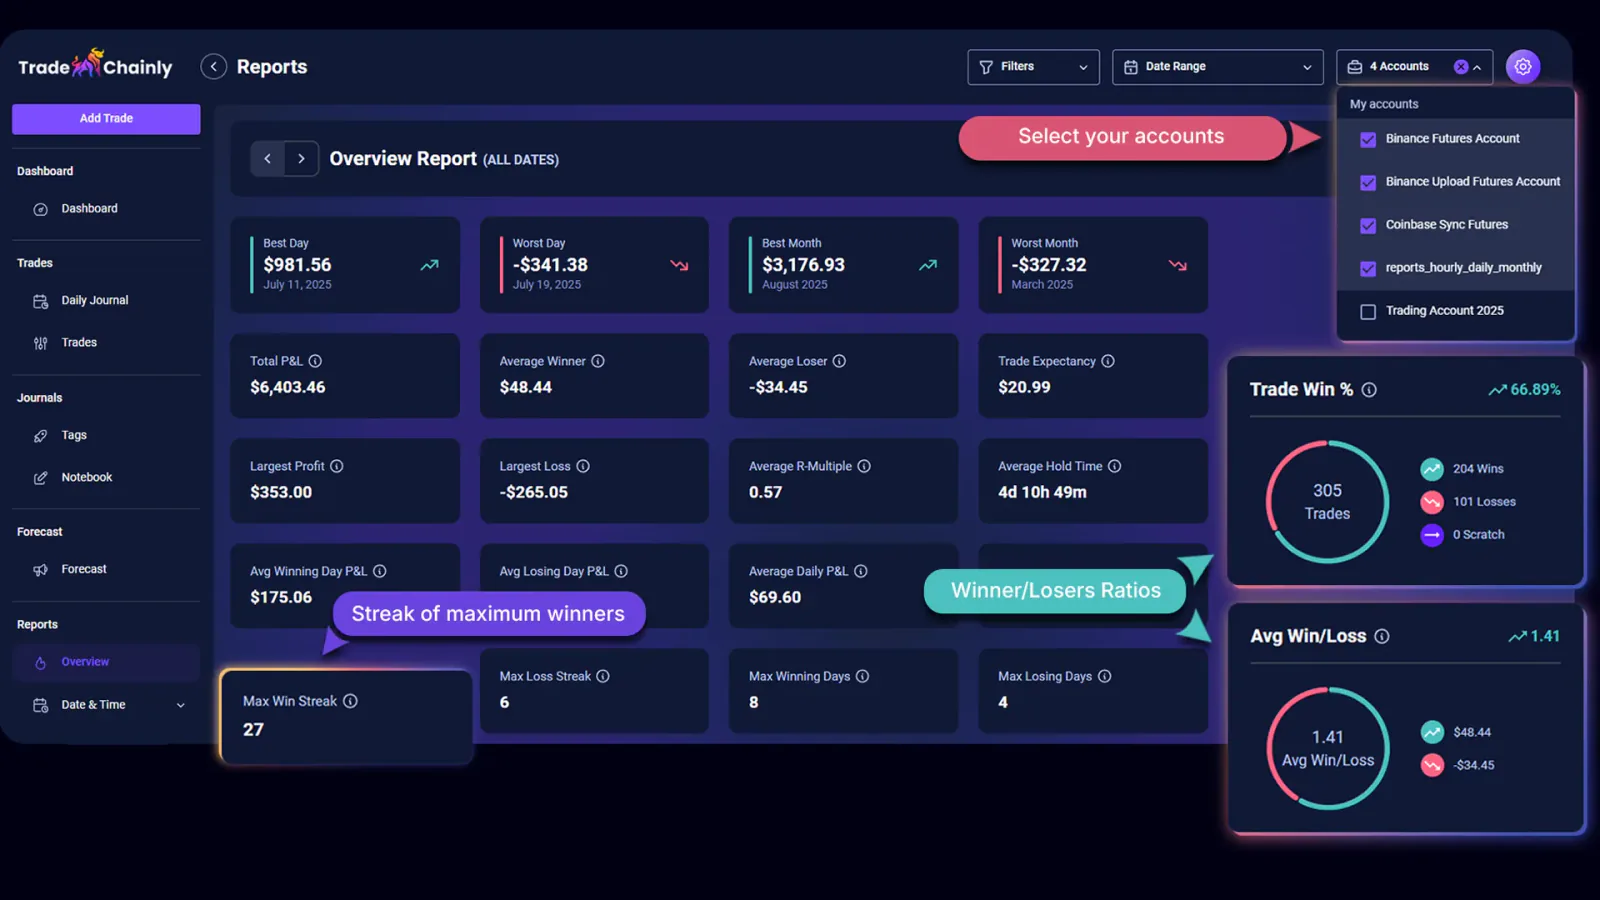
Win rate alone does not tell the full story in crypto trading. That is why TradeChainly includes metrics like Average Win/Loss ratio and Profit Factor. Average Win/Loss shows the size of your average winner compared to your average loser. Profit Factor compares total profits to total losses. A trader with a 40 percent win rate can still be consistently profitable if the average winner is much larger than the average loser. The Dashboard makes that pattern obvious.
You also see performance broken down by trading days. The Daily Net Cumulative P&L chart shows how your account grows or contracts over time based on realized results. The Net Daily P&L chart shows profit or loss per trading day. This helps you spot streaks, high volatility periods, or changes in your execution quality. Crypto trades around the clock, so understanding your daily rhythm becomes important if you want consistency.
TradeChainly also gives you snapshots like top performing symbols, best and worst days of the week, hourly performance windows, and a calendar-style view of daily results. If you mainly scalp BTC and ETH perpetuals, you might quickly notice that one symbol performs better for you than the other. Or you might see that your trading results tend to drop during certain hours, such as late at night when you are tired or less focused.
All of these metrics are calculated automatically. You do not build formulas. You do not manage pivot tables. TradeChainly translates raw executions into insights so you can spend your time asking better questions. Why are my losers larger this month? Why is Tuesday consistently profitable but Friday isn’t? Why is my win rate stable, but expectancy falling? The Dashboard becomes the place where those questions start.
This page is not about hype or flashy charts. It is about clarity. Good trading is boring, structured, and repeatable. The Dashboard in TradeChainly helps you build that structure by showing you exactly where you stand, whether you are on a hot streak, or whether it is time to slow down and reset before mistakes compound.
Daily Journal: Reviewing Each Trading Day Like a Pro
One of the biggest mistakes crypto traders make is only reviewing trades individually. Trade-by-trade review is important, but most bad habits show up at the day level. Overtrading, revenge trading, chasing breakouts, ignoring risk rules, holding losers too long. These are daily behavior patterns, not isolated moments. That is why the Daily Journal page inside TradeChainly is such a powerful tool.
The Daily Journal organizes your trading activity into weekly views. You can scroll between weeks and quickly see each day summarized inside a card. On every day card you see your cumulative net P&L, gross P&L, fees, win percentage, volume, profit factor, and all trades executed that day. This gives you a fast snapshot of whether you traded well or whether the day got away from you.
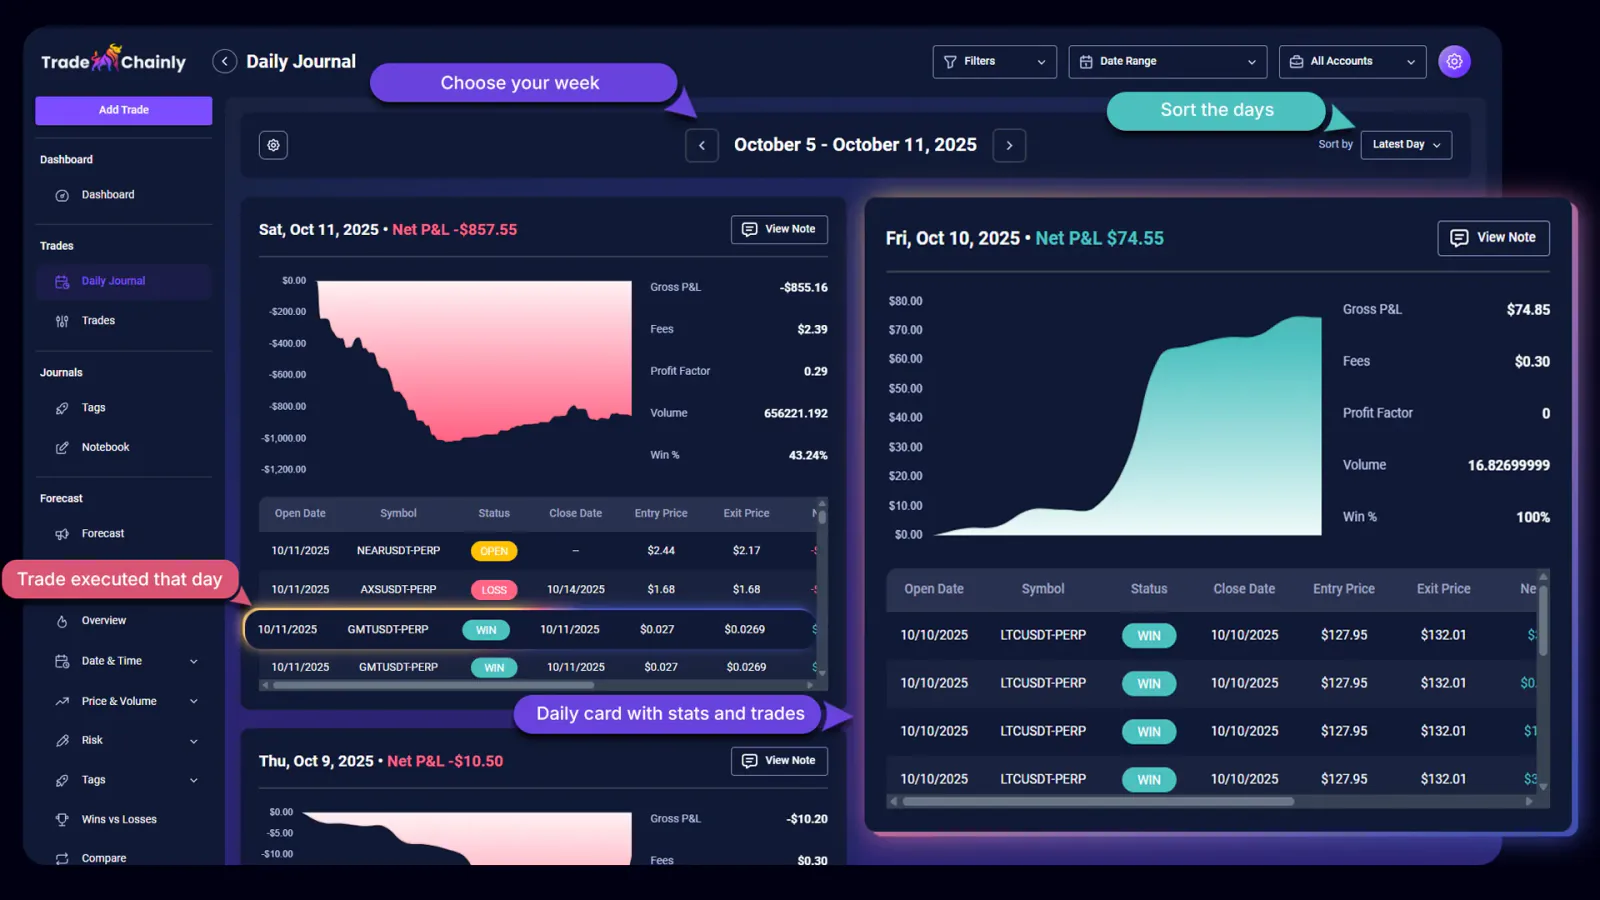
You are not locked into one viewing style either. TradeChainly allows you to sort days within the week by different criteria. You can sort by newest day first, oldest day first, highest profit, biggest loss, highest win percentage, or lowest win percentage. This makes it easy to isolate both your best and worst days for deeper review. Many traders learn more from their losing days than their winning ones, so this sorting feature helps you face the truth without emotion.
Every trading day also has its own notes area. This is where the real growth happens. You can log what went well, what went wrong, what you were thinking, and what you want to improve tomorrow. Maybe you forced trades during low volume. Maybe you traded during news events when volatility spiked. Maybe you stuck to your plan and executed perfectly. Writing this out builds awareness, and awareness leads to improvement.
The Daily Journal also lets you customize what columns you see inside the trades table for each day. If you care about entry price, exit price, position size, or trade rating, you can configure the table to highlight what matters most to you. This is especially useful for active traders who execute many trades in a day and need fast visual review.
Imagine finishing a trading day on Bybit where you traded BTC and SOL perpetuals. You open TradeChainly, go to the Daily Journal, and immediately see that you finished slightly red. After reviewing the trades and writing your notes, you realize most losses happened late in the session when you were tired and started forcing trades. That insight becomes a new rule: stop trading after a certain time or after reaching a daily loss threshold.
This is how disciplined traders operate. They trade, they review, they adapt. TradeChainly is built to support that process at the day level, not just the trade level. Over time, your daily notes become a record of your growth and mindset evolution as a trader.
Trades & Trade Details: Reviewing Every Execution
The Daily Journal helps you understand your behavior at the day level. But sometimes you need to zoom all the way in and study each individual execution. This is where the Trades page and the Trade Details page inside TradeChainly become essential. They allow you to look at every trade objectively and answer one simple question: did I follow my plan?
The Trades page shows all of your trades in a clean, filterable table. At the top, you see important performance metrics such as Profit Factor, Trade Win Percentage, Average Win/Loss ratio, and Day Win Percentage. These numbers give you immediate feedback on how your trading system is behaving across all trades that match your filters.
Below the metrics is the full trades table. You can choose which columns you want to see, so the view matches your review style. Some traders prefer to see entry price, exit price, symbol, side, P&L, and ROI. Others want fees, position size, or timestamps. TradeChainly lets you configure this so you are not overwhelmed with data you do not care about.
Because crypto traders often generate a large number of trades, backend pagination keeps everything smooth. You can choose to view 25, 50, 75, or 100 trades per page. You can also use filters and global filters to narrow your review down to specific exchanges, accounts, symbols, setups, mistakes, or date ranges. This is useful when you want to study only BTC trades, or only longs, or only trades marked with a specific mistake tag.
There are also powerful bulk actions on the Trades page. You can mark groups of trades as reviewed or not reviewed, assign tags, export to CSV, transfer trades between accounts, or delete trades if needed. This helps keep your journal organized so you always know which trades you have already studied.
When you click into any trade, you are taken to the Trade Details page. This is where deeper analysis happens. You can navigate between trades easily using forward and backward controls, which makes reviewing multiple trades fast and smooth.
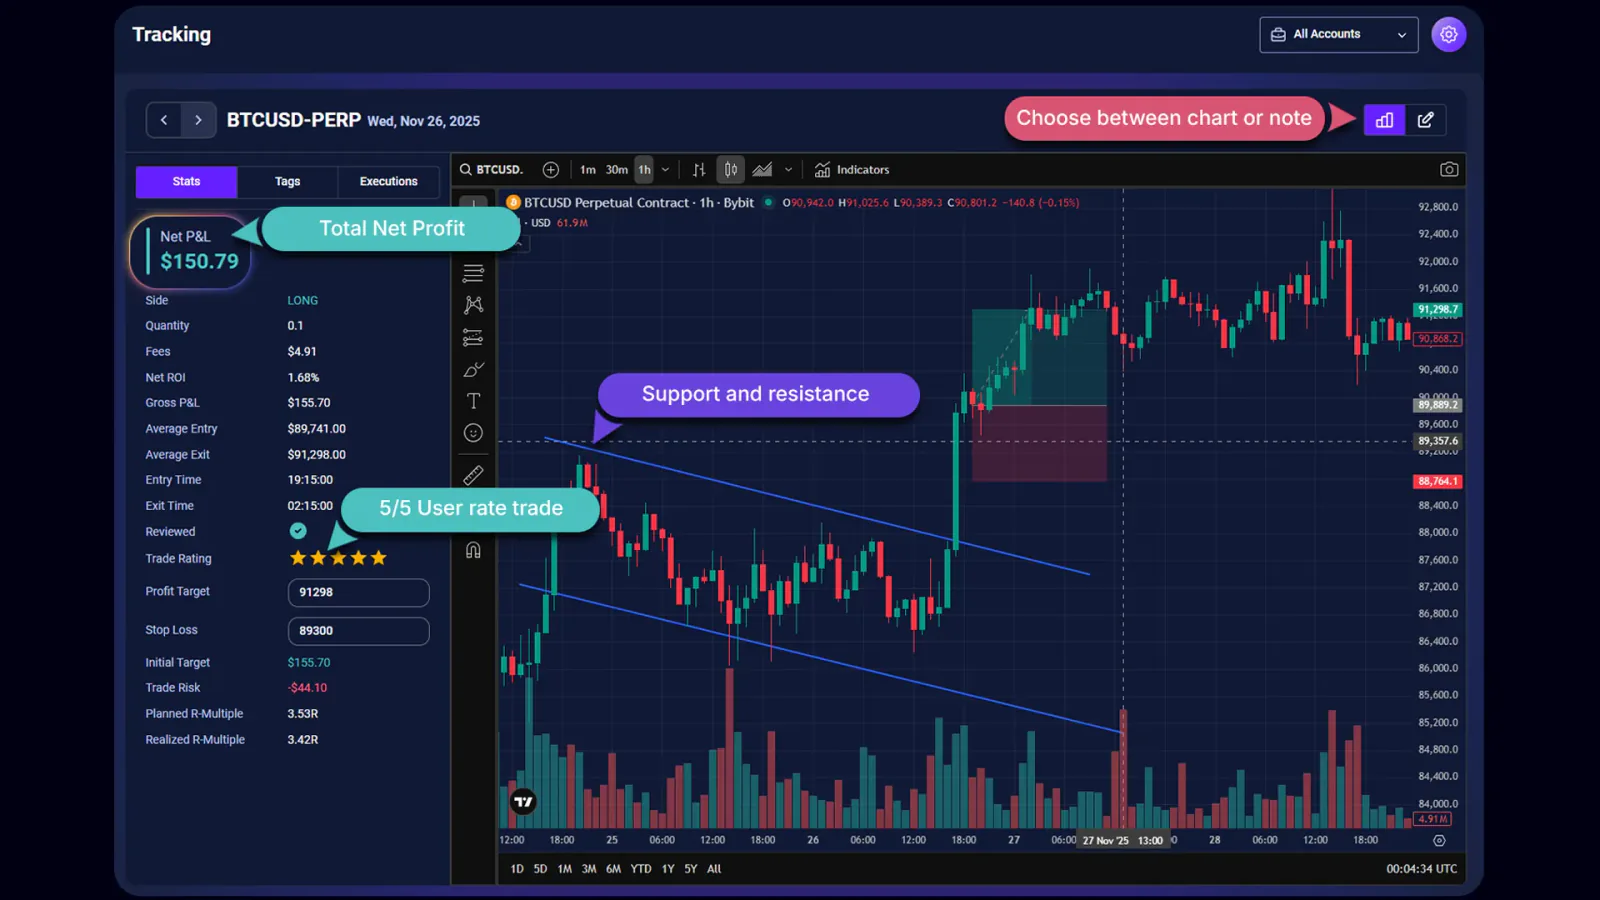
Inside the Trade Details view, the left side contains tabs for Stats, Tags, and Executions. The Stats tab shows everything you want to know about the trade: Net P&L, Gross P&L, Fees, Net ROI, Side, Entry Time, Exit Time, Average Entry, Average Exit, whether the trade is reviewed, and the Trade Rating you assign. You can also define your Profit Target and Stop Loss for proper risk management. Once you add these values, TradeChainly calculates metrics like Initial Target, Trade Risk, Planned R-Multiple, and Realized R-Multiple.
This turns your review from emotional to mathematical. Instead of “it felt like a good trade,” you see whether the reward-to-risk ratio actually made sense. You also see whether you are consistently taking trades that align with your plan or drifting into random decision making.
The Tags tab shows all tags assigned to the trade and allows you to add new ones. This could include setups such as breakout or momentum trading, or mistakes like revenge trading or overleveraging. Over time, this creates powerful analytics inside the Tag Details pages.
The Executions tab lists all orders tied to the trade. This is especially useful for scalpers or traders who scale in and out. You can see how you built the position and where you exited.
On the right side of the Trade Details page, you either see a TradingView chart or the note editor. The TradingView chart lets you visually review the market context around your trade. If you switch to notes, you can write your thoughts and even attach screenshots. Many traders use this area to break down why they took the trade, what worked, and what they would change next time.
Picture this workflow. You traded ETH perpetuals on Binance with high leverage. The trade looked great at the time, but you stopped out. Later that day, you open the Trade Details page in TradeChainly. You see your Realized R-Multiple was negative, your stop was too tight relative to volatility, and you chased an entry after a breakout. You record this in your notes and assign the “fomo” mistake tag. That becomes data you can measure later, not just a vague memory.
This is how real improvement happens. Review. Reflect. Adjust. Repeat. TradeChainly makes that process simple and structured.
Tags & Tag Analytics: Turning Patterns Into Insights
Most traders think they know what their best setups are. They also think they know which mistakes cost them the most money. But when you actually measure it, the truth is often different from what you remember. That is why tagging trades in TradeChainly is so valuable. Tags turn your trading activity into measurable patterns instead of guesses.
Inside TradeChainly, tags are organized into categories. By default, you already have two important ones: Setups and Mistakes. Setups might include things like breakout trading, momentum trading, scalping, or swing-reversal. Mistakes might include overleveraging, revenge trading, FOMO, or not cutting losses quickly. You can also create your own categories and tags if you want to reflect your personal trading strategy.
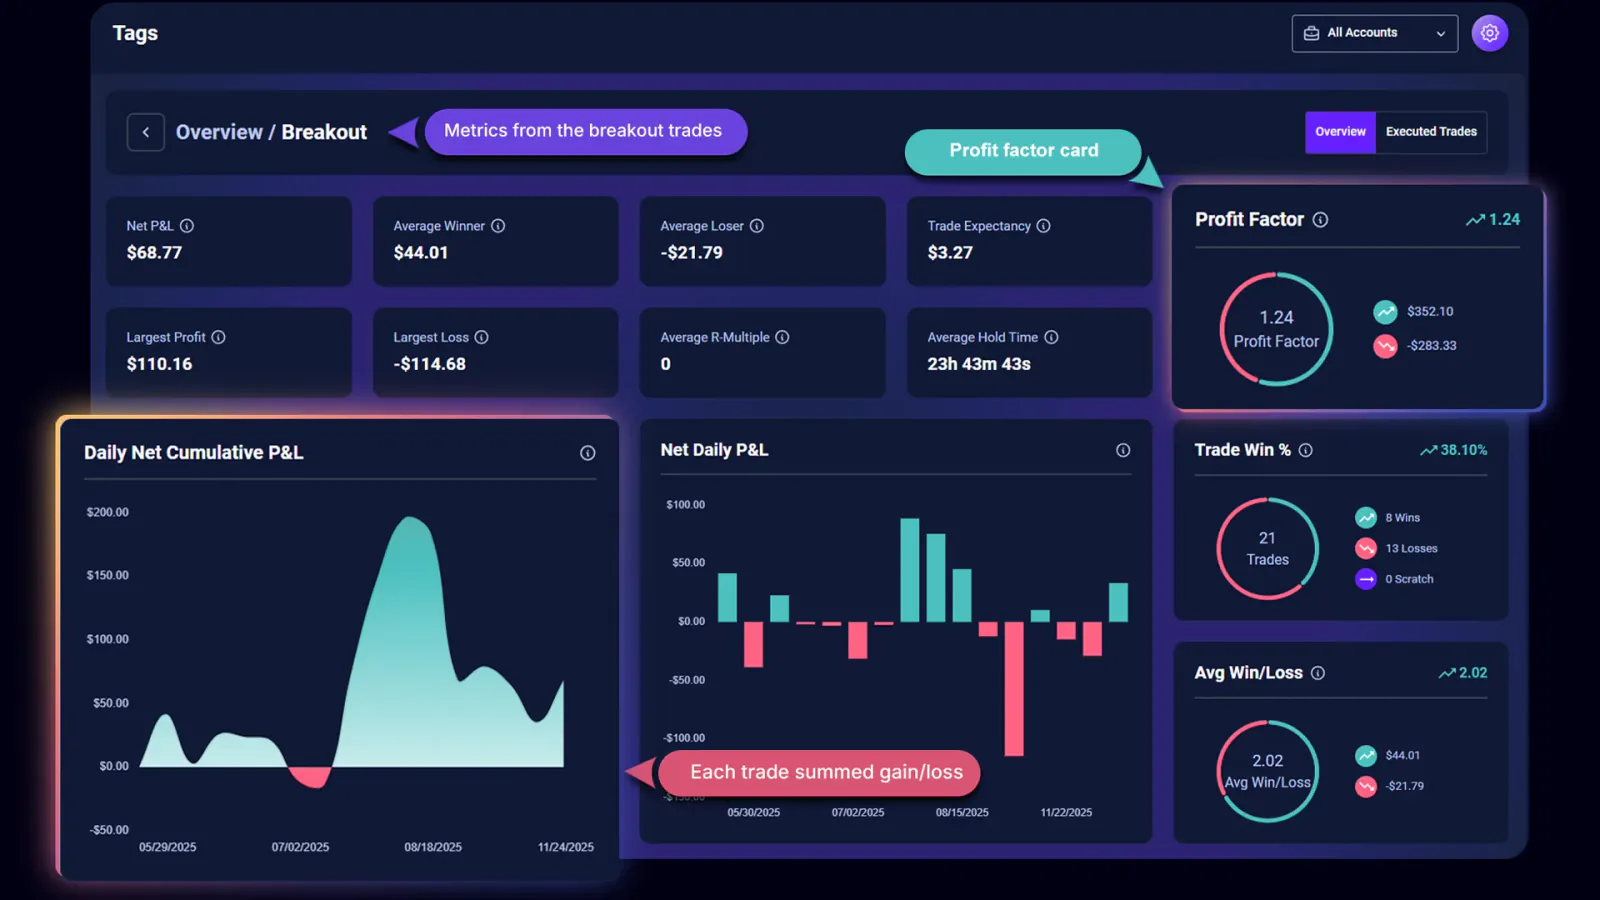
You can assign tags to trades individually or in bulk. Over time, as more trades get tagged, TradeChainly starts to surface meaningful insights. Each tag clearly shows key performance metrics such as Net P&L, Profit Factor, Win Percentage, Average Winner, Average Loser, and how many times the tag has been used. This lets you see very quickly which setups make you money and which ones drain your account.
The real depth comes from the Tag Details page. When you click on any tag, you are taken to a dedicated analytics view. Here you can study the performance of that tag in isolation. You can see Net P&L, Average Winner, Average Loser, Trade Expectancy, Largest Profit, Largest Loss, R-Multiple averages, Hold Time averages, Win Rate, and Profit Factor. You also get charts showing cumulative daily profit, daily results, and trade distributions over time.
This type of analysis is incredibly valuable for day traders and scalpers. You might discover that your breakout trades have a lower win rate but strong expectancy because the winners are much bigger. Or you might realize that a mistake like revenge trading consistently produces the largest drawdowns. Instead of vague feelings like “I think this works for me,” you see the math behind every pattern.
There is also an Executed Trades tab inside each Tag Details page where you can view every trade that used that tag. From there, you can apply bulk actions or drill back into individual trades for deeper review. So the workflow becomes simple. Identify a pattern at the tag level, then zoom into the trades if you want to understand the behavior behind the numbers.
For crypto traders, this is one of the biggest competitive advantages you can have. Markets move fast. Your emotions react even faster. Without structured tagging, all of this experience fades into unreliable memory. With TradeChainly, every lesson is captured, organized, and measurable. Over time, you refine your strategy based on evidence, not emotion. And that is how traders build long-term consistency.
Notebook: Centralized Trading Notes
Every serious trader eventually realizes that numbers alone are not enough. Your metrics tell you what happened. Your notes explain why it happened. That is where the Notebook page inside TradeChainly comes in. It gives you a single place to manage all of your trading notes so nothing gets lost or scattered across random files, notepads, or messaging apps.
The Notebook organizes your notes into three main types: trade notes, daily notes, and custom notes. Trade notes are linked directly to individual trades. You can create these from the Trade Details page or inside the Notebook itself. Daily notes are tied to a specific trading day, often created from the Daily Journal page. Custom notes are for everything else. Strategy thoughts, mindset reflections, rule updates, or anything meaningful you want to document.
Each note uses a rich text editor so you can write clearly and structure your thoughts. You can also attach screenshots to your notes. Many traders like to include chart images, trade setups, or visual examples to go along with their reflections. This makes the Notebook a true trading journal rather than just a list of plain text entries.
The search and filtering tools inside the Notebook make it easy to find what you need. You can filter trade notes by symbol or date range. You can filter daily notes by day range. Or you can simply search across your notes library. This becomes more powerful over time as your journal grows. Instead of losing years of learning in scattered documents, everything sits inside one organized system.
Think about the value of this after trading for six months or a year. You can look back at your earlier notes and see how your mindset, discipline, and strategy evolved. You can study what you were thinking during drawdowns versus winning streaks. You can revisit lessons learned from old mistakes so you do not repeat them when market conditions change.
Crypto trading is intense. It tests patience, emotional control, and execution discipline. The Notebook inside TradeChainly gives you a private space to process all of that in a structured way. Combined with the analytics, it turns your trading journal into both a performance tool and a personal learning record.
Forecast Page: Forward-Looking Market Intelligence
Most trading journals only look backwards. They tell you what happened after the fact. That is valuable, but crypto traders also need tools that help them prepare for what might happen next. The Forecast page inside TradeChainly gives you that forward-looking perspective. It does not replace your own analysis or trading plan, but it gives you structured market intelligence that you can use as part of your preparation.
On the Forecast page, you see two forecasting models displayed side by side. You can choose from more than sixty crypto assets, including the popular ones like BTC, ETH, SOL, XRP, and many others. You also choose the timeframe you care about, such as 5 minute, 15 minute, 30 minute, or 1 hour. Or you can choose the number of steps like 25, 50, 75, or 100. Once selected, each model shows a price chart that combines historical price data with predicted future movement.
Under each chart, TradeChainly shows six important metrics. These help you understand the nature of the forecast rather than just looking at a line on a chart.
Trend shows the expected direction. A bullish trend suggests price strength, a bearish trend signals weakness, and neutral means consolidation is likely.
Average Percentage Change shows the expected magnitude of price movement. Positive values suggest upward drift. Negative values suggest downward pressure. This helps you gauge whether the expected move is meaningful or minor noise.
Volatility shows how stable or unstable the market might be. Higher values suggest more unpredictable price action, which matters a lot for leveraged crypto traders.
Cumulative Return estimates the total dollar gain or loss across the forecast period. Traders often use this to understand potential trade justification rather than chasing every micro move.
Concentration Price highlights the price level where the asset spends the most time in the forecast window. This helps identify likely “fair value” zones or consolidation areas.
Maximum Drawdown shows the worst expected peak-to-trough decline during the period. This is especially useful for risk-conscious traders who want to avoid oversized downside exposure.
When you combine these metrics with your own trading system, you move from reactive trading to more structured preparation. For example, if the forecast shows high volatility and a bearish trend for ETH, a scalper might plan for momentum shorts or avoid overleveraged longs. If the volatility projection is low, a breakout strategy might be less attractive.
The Forecast page is not about predicting the future with certainty. No tool can do that. It is about improving your awareness of potential price dynamics so you can plan your trades with a clearer understanding of risk and opportunity. When paired with your trade reviews, this helps you stay intentional instead of impulsive.
Reports: Deep-Dive Performance Analytics
Most traders only look at surface-level performance. They check whether they made or lost money and then move on. But serious crypto traders know that consistency comes from understanding the deeper patterns behind your results. TradeChainly’s Reports section is designed for that level of analysis. It allows you to break down your performance from multiple angles so you can see exactly where your edge exists and where your weaknesses hide.
The Overview Report is usually the first stop. Here you see key summary metrics like Best Day, Worst Day, Best Month, Worst Month, Total P&L, Average Winner, Average Loser, Largest Profit, Largest Loss, Expectancy, R-Multiples, Hold Times, Max Win Streak, Max Loss Streak, and Daily P&L trends. This gives you a broad understanding of how your trading system behaves across time. You can quickly see whether your performance is smoothing out, improving, or becoming more volatile.
Then there are more focused reports. The Hourly Report shows performance by time of day. You can choose intervals such as 1 hour, 30 minutes, 15 minutes, or 5 minutes, and you can analyze by entry or exit time. This matters a lot in crypto because the market trades 24/7. You may discover that you trade best during certain sessions and much worse during others. That insight alone can change your results by helping you avoid low-quality trading windows.
The Daily Report and Monthly Report let you see performance across weekdays and months. Maybe Mondays are strong for you but Fridays lead to losses. Or perhaps you do well in trending months but struggle during choppy periods. TradeChainly turns those patterns into measurable data instead of guesswork.
The Symbol Report is another powerful tool. Crypto traders often focus on BTC, ETH, and a few altcoins. With this report, you see which symbols actually perform best for you. You might learn that your ETH trades are consistently more profitable than BTC, or that certain altcoins behave poorly with your strategy. You can even choose to review the top or bottom twenty performing symbols.
Other reports go even deeper. The Trade Duration Report shows how long your winners and losers typically last. The Entry Price and Volume Reports help you understand how market conditions affect your execution. The R-Multiple and Position Size Reports reveal whether your risk management is consistent or drifting. And the Wins vs Losses Report breaks down your profitable and losing trades separately so you can compare behavior between the two.
For many traders, the Tags Report becomes a breakthrough moment. You can see which setups, mistakes, or emotional patterns are generating profits or losses. This connects directly with the tagging workflow from earlier sections. TradeChainly does not just store tag data. It transforms it into real performance analytics.
One of the most advanced tools is the Compare Report. Here you can compare two groups of trades side by side based on filters like open or closed status, date ranges, setups, mistakes, symbol, side, or trade rating. This is incredibly useful if you want to test how one type of trade performs versus another. For example, you might compare breakout trades to reversal trades, or reviewed trades versus unreviewed trades.
The goal of all these reports is simple. Help you stop trading blindly. Help you understand where your real edge exists. Help you eliminate behaviors that cost you money. And help you refine your trading approach using data from your own history, not someone else’s strategy from social media.
TradeChainly gives you institutional-level analytics in a format that is approachable and practical for everyday traders. If you use these reports consistently, review your results honestly, and make adjustments based on what you learn, your trading process becomes sharper, calmer, and more intentional over time.
Global Filters: Slice Your Data Any Way You Want
If you trade across multiple exchanges, accounts, symbols, and strategies, your journal can quickly become a large dataset. That’s a good thing, but only if you can filter and isolate what matters. TradeChainly’s global filters make this easy. They let you slice your trading history in a way that matches how you think about your strategy, so you can analyze the right trades at the right time.
Global filters apply across the platform. That means your Dashboard, Trades page, Daily Journal, Reports, and Tag analytics will all reflect the filters you set. For example, if you only want to analyze trades from your Bybit futures account, you can select that account and instantly see metrics, charts, and tables filtered to that specific data. No exports. No spreadsheets. Just clean, focused analysis.
You can also filter by date range. This is helpful when you want to study specific periods like a strong month, a losing streak, or a time when you changed your strategy. Maybe you started using tighter stops in November and want to see how that affected your R-Multiples and win rate. Set the range and TradeChainly shows you exactly what changed.
Another powerful use case is filtering by symbol. If you mainly trade BTC, ETH, and SOL perpetuals, you might want to study each one separately. BTC might reward trend-following strategies, while SOL might behave more aggressively during volatility spikes. With symbol filtering, you no longer mix everything together. You see precise performance by asset.
You can also filter by setups, mistakes, trade rating, reviewed status, direction, and more. This gives you control over how you analyze behavior. Want to see only your revenge trades? Done. Want to analyze only trades rated 4 and 5 so you can understand what “good trading” looks like for you? Also possible. Want to isolate unreviewed trades so you can complete your journaling session? Simple.
Accounts are another key layer. Many traders run multiple accounts for different purposes, such as discretionary trading versus systematic strategies. In TradeChainly, you can add up to twenty accounts and filter results for each one. This keeps strategy analysis structured instead of blended together.
The power of global filters is that they work seamlessly across every TradeChainly page. You do not need to reapply filters in every section. Once your filters are set, the entire platform focuses on that specific slice of your trading history. This saves time and helps you stay disciplined in your review routine.
For crypto day traders and scalpers, this level of control matters. Market conditions change. Strategies evolve. Risk tolerance shifts. Global filters let you track these transitions clearly instead of guessing how your edge behaves over time. When you can isolate variables, you can improve them. TradeChainly’s filtering system is built exactly for that purpose.
Real-World Workflow: How a Day Trader Uses TradeChainly
So far, we’ve walked through TradeChainly feature by feature. Now let’s put it all together and look at how a real crypto day trader might use TradeChainly as part of a daily and weekly workflow. This helps you see how the platform fits naturally into your trading routine instead of feeling like another task on your to-do list.
Imagine you are an active futures trader on Binance and Bybit. You mainly scalp BTC and ETH perpetuals with occasional trades on altcoins like SOL or XRP. You have TradeChainly connected to your exchange accounts, so trades sync automatically in the background.
Your day starts with preparation. Before the session, you open TradeChainly and quickly check the Dashboard. You look at your recent P&L curve, win rate trends, and profit factor. You aren’t trying to predict the future. You’re simply grounding yourself in reality. If you notice a recent drawdown, you remind yourself to trade smaller and focus on discipline. If your results are strong, you stay alert for overconfidence.
If you want additional market context, you might open the Forecast page and review volatility expectations and trend bias for BTC or ETH. This does not replace your strategy. It just gives you a structured forward-looking view so you understand the potential trading environment before you place a single order.
Then you trade your plan. You execute on the exchange. You manage risk. You take entries and exits. Meanwhile, TradeChainly quietly imports everything for you. You do not have to log anything manually while your focus is on the market.
When the session ends, the real work begins. You open the Daily Journal inside TradeChainly and review your day. You look at your net P&L, win percentage, volume, and profit factor. You scroll through the trades taken and write a short reflection in the notes area. Maybe you journal that you cut losses fast and followed your plan well. Or maybe you admit that you chased a few trades during chop and will avoid that setup tomorrow.
If you want deeper insight, you go to the Trades page and open specific trades inside the Trade Details view. You review the chart, check your R-Multiple, and tag the trade according to your setup and behavior. Good trades get rated higher. Emotional or impulsive trades get tagged appropriately so they show up in your analytics later.
At the end of the week, you use TradeChainly for a more structured review. You open the Reports section and filter your trades to the last seven days. You study your best and worst trading days. You look at symbol performance. You review your tags to see which setups worked and which mistakes cost you money. If you see that revenge trading created the largest losses, you commit to stopping after a defined daily limit next week.
Over time, this routine compounds. Your trading becomes less reactive and more intentional. You stop guessing which setups are profitable and start trusting the data. Your notes reflect your growth as a trader. You understand yourself better. And because TradeChainly handles the automation and organization, the process feels natural rather than heavy.
This is the outcome TradeChainly is built for. Not perfection. Not overnight success. But steady, structured improvement driven by real trading data and consistent review habits.
Building a Consistent Crypto Trading Process
If you look at the traders who last in crypto, they usually have one thing in common. They treat trading like a real business. That means they track performance, review decisions, study data, and continuously refine their edge. Winning in crypto is not about guessing the next pump. It is about building a repeatable process and sticking to it through different market conditions.
TradeChainly exists to support that kind of trader. It gives you automatic trade syncing from the biggest crypto exchanges. It organizes your trading history into clean dashboards and deep analytics. It helps you review trades, analyze setups and mistakes, track daily behavior, write meaningful notes, and study risk metrics. Everything is built specifically for crypto day traders and scalpers, not as an afterthought bolted onto a generic trading platform.
The goal is simple. Remove friction. Increase clarity. Help you understand what is actually happening in your trading so you can improve with intention instead of emotion. Whether you are trading BTC perpetuals, altcoin scalps, or a mix of both, TradeChainly gives you the structure you need to stay honest with yourself.
If you’ve been relying on memory, screenshots, spreadsheets, or journals that you eventually abandon, it might be time for a system that fits the way you trade. TradeChainly brings all of your trading, notes, analytics, and performance review into one place so you can finally build consistent habits that support long-term success.
Your trades are already telling you a story. TradeChainly simply helps you read it.