
Crypto Trading Metrics Don’t Lie. Your Interpretation Does
Win rate stays high and the account still bleeds. Net PnL looks fine for weeks, then a single volatility spike erases it. If that sounds familiar, it’s usually not the market. It’s the way performance is being read.

If you trade crypto intraday and feel like your results never quite line up with how “well” you think you’re trading, you’re not imagining it. Most crypto traders misread their performance because they rely on the wrong numbers or interpret the right ones in the wrong way.
The most common trap is staring at net PnL and win rate. Green is good, red is bad. That logic works at a very shallow level, but crypto punishes shallow analysis fast. You can be up money while trading poorly, and you can trade well while losing money in the short term. Without deeper context, your stats end up telling a misleading story.
Crypto amplifies this problem. Leverage compresses time and magnifies outcomes. A small execution mistake can wipe out several clean trades. Funding rates quietly eat edge in strategies that hold longer than intended. Volatility spikes turn average losses into oversized ones. None of that shows up clearly in a simple win rate column.
Another issue is survivorship bias inside your own data. A few large winners can mask dozens of small execution errors. You look at the equity curve and assume consistency, but underneath it you might be overtrading, cutting winners early, or letting losers stretch beyond your plan. The account survives, but the process degrades.
Plenty of traders get stuck right here. They feel something is off, but the numbers they track don’t explain why. So they default to vague conclusions like “I need more discipline” or “I just need to be more patient.” Those statements sound reasonable, but they are not actionable because they are not anchored to data.
Crypto also breaks many assumptions traders inherit from stocks or FX. Markets never close. Sessions overlap in unpredictable ways. Liquidity changes drastically on weekends. Funding flips from tailwind to headwind depending on positioning. If you use generic performance metrics without adjusting for these realities, you end up drawing the wrong lessons from your own trades.

The core problem is not that traders don’t track metrics. It’s that they track results without understanding the mechanics behind them. Performance is treated like a scorecard instead of a diagnostic tool. When that happens, metrics become emotional triggers rather than feedback.
A proper performance framework does the opposite. It separates outcomes from execution. It shows you where money is made, where it is lost, and more importantly, why. It helps you spot repeatable edges and recurring leaks, even when PnL alone looks fine.
Before diving into specific metrics, it’s important to reset the goal. You are not trying to prove that you are a good trader. You are trying to understand how your trading actually behaves under real crypto conditions. Once you approach metrics with that mindset, the data starts working for you instead of against you.
Let’s draw a clean line between results metrics and process metrics, because confusing the two is where most traders go wrong.
Results vs Process: Build a Cleaner Feedback Loop
A critical shift you can make as a crypto day trader is separating results metrics from process metrics. Most traders mix them together, then wonder why their reviews feel confusing or emotionally charged.
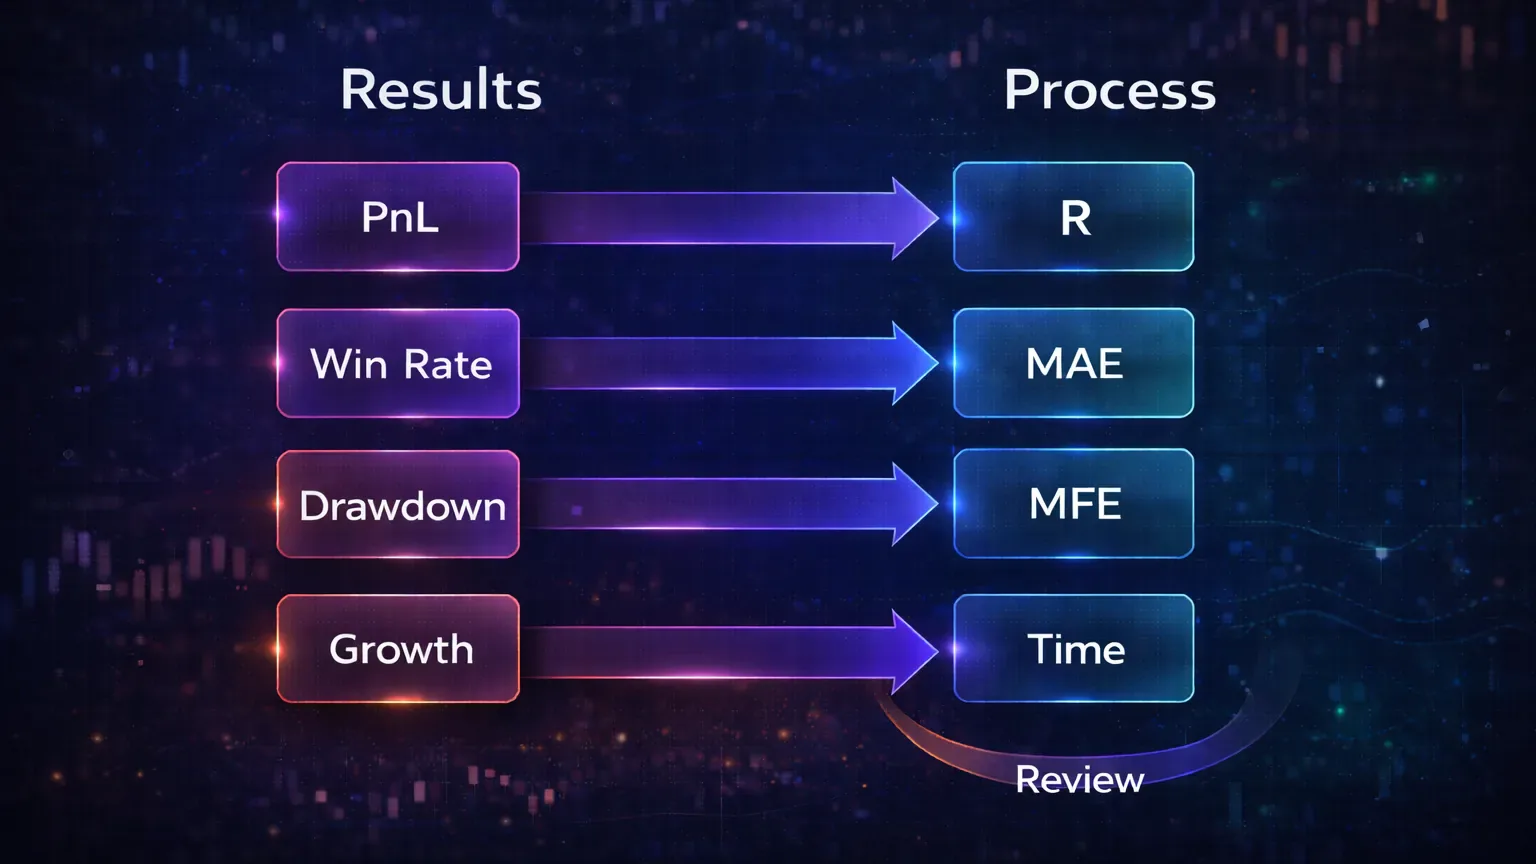
Results metrics tell you what happened. Net PnL, win rate, account growth, and drawdown all fall into this category. They are outcomes. They matter, but they are lagging indicators. By the time they move, the behavior that caused them has already happened.
Process metrics tell you how those results were produced. They describe execution quality, risk behavior, and consistency. Things like average R per trade, MAE, MFE, time in trade, and adherence to your plan live here. These metrics move faster than PnL and often signal problems long before your account balance does.
Crypto makes this distinction even more critical. Because markets run 24/7, you can rack up dozens of trades in a short window. A strong session can hide sloppy execution. A bad volatility spike can punish clean trades. If you only look at results, you react to noise. If you look at process, you see patterns.
Here’s a simple example. Two traders finish the week up 3%. Trader A took fewer trades, respected stops, and let winners expand when volatility allowed. Trader B overtraded, chased breakouts late, and survived mainly because one oversized winner bailed out the week. On paper, the performance looks identical. In reality, one trader reinforced good habits while the other reinforced bad ones.
This is why traders often feel confused after “good” weeks. The PnL is green, but something feels off. Maybe stress was high. Maybe decisions felt rushed. Process metrics explain that disconnect. They show whether your edge is being expressed cleanly or distorted by execution errors.
Another common mistake is judging a single trade in isolation. A stop-out feels like a failure, so traders adjust rules emotionally. But a single trade tells you nothing. Process metrics only become meaningful across a sample. In crypto, that sample builds quickly if you trade actively, which is an advantage if you know what to measure.
Results metrics answer the question: did I make or lose money?
Process metrics answer a more useful question: am I trading in a way that should make money over time?
When traders ignore this distinction, reviews turn into self-criticism sessions. When they respect it, reviews turn into engineering problems. Something is off, the data shows where, and adjustments can be tested deliberately instead of emotionally.
Now we can talk about the core performance metrics every crypto day trader should track. Not as a checklist, but as a system that explains what your trading is actually doing beneath the surface.
Core Metrics That Describe Your Edge
Once you separate results from process, the next step is choosing the right core metrics. Not every statistic deserves your attention. The goal is to track a small set of numbers that explain most of your performance, especially in leveraged crypto markets where small leaks compound fast.
Net PnL: Use It as a Headline, Not a Diagnosis
Net PnL is unavoidable. It tells you whether your account is growing or shrinking. What it does not tell you is why. Two months with identical net PnL can be driven by completely different behaviors. One might come from consistent execution. The other might come from a single volatility event or an oversized position.
In crypto, net PnL is especially noisy. Funding payments, fee structures, and position sizing differences across exchanges can distort it. A trader who holds positions slightly longer than planned may bleed edge through funding without realizing it. The PnL still looks fine until it suddenly doesn’t.
Use net PnL as a headline metric. Never use it as a diagnostic one.
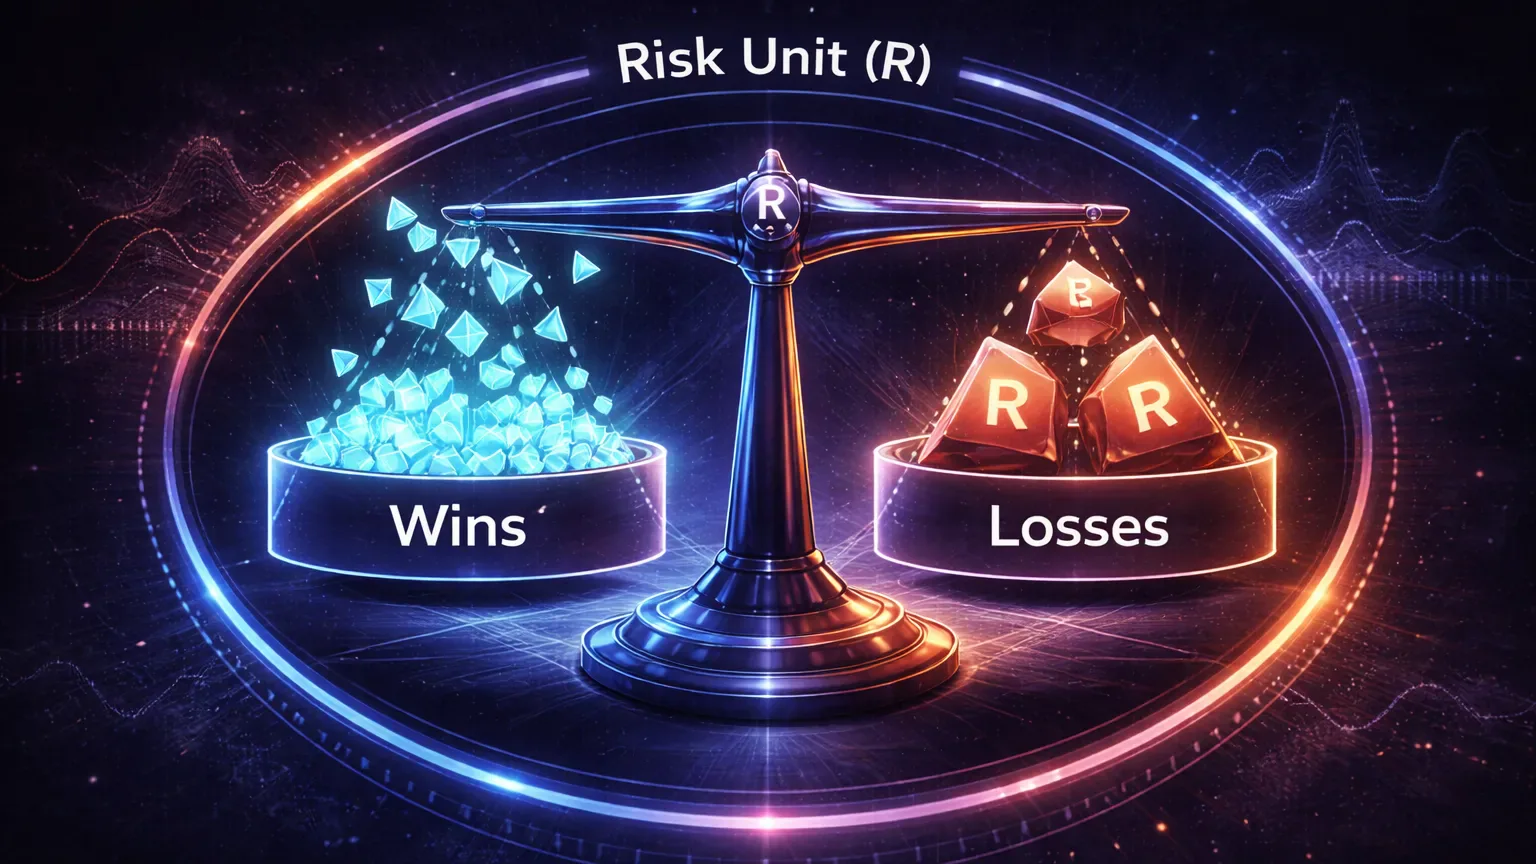
Expectancy: Put Your Edge in R Terms
Expectancy answers a simple question: how much do you make or lose on average per trade, relative to risk? In crypto day trading, expectancy is far more useful than win rate because it captures both frequency and magnitude.
A common formula is:
- Expectancy = (Win rate × Average win) − (Loss rate × Average loss)
The key is to express this in R terms, not dollars. Dollar-based expectancy gets skewed by position size and leverage. R-based expectancy tells you whether your decision-making process is sound.
Many crypto traders are shocked when they first calculate this. High win rate strategies often show weak or negative expectancy because average losses are too large. Low win rate strategies can be highly profitable because winners are allowed to expand during volatility.
If you trade perpetuals, expectancy also absorbs funding effects indirectly. A strategy that holds slightly too long during negative funding periods often sees expectancy drift down even when win rate stays stable.
Average Win vs Average Loss: Protect The Payoff Profile
This ratio quietly defines what kind of trader you are. In fast-moving crypto markets, it also reveals whether you are cutting winners early or letting losers stretch.
Scalpers often accept smaller average wins, but that only works if losses are tightly controlled. Day traders aiming for larger moves need average wins that comfortably outweigh losses, otherwise volatility works against them.
Problems show up quickly here. If your average loss is creeping up over time, something in your execution has changed. Late exits. Hesitation on stops. Trading during low-liquidity periods. This metric catches those shifts early.
Win Rate: Only Useful With Context
Win rate is not useless. It is just dangerous when viewed alone.
A 65% win rate means nothing without knowing the average win and loss. In crypto, high win rate strategies often involve mean reversion or tight targets. They feel good until a liquidation cascade or news-driven move wipes out several days of gains in one trade.
Use win rate as a supporting metric. When expectancy drops, win rate helps you understand whether the issue is frequency or magnitude. On its own, it tells you very little.
Profit Factor: A Supporting Metric, Not The Whole Story
Profit factor compares gross profits to gross losses. Anything above 1.0 is technically profitable. In practice, crypto traders should be cautious with this metric.
A high profit factor can be inflated by one large winner. A low trade count can make it unreliable. It also ignores time and drawdown, which matter in leveraged environments.
Profit factor works best when viewed over a large sample and alongside expectancy. If both are healthy, your edge is likely real. If they diverge, something needs investigation.
Drawdown: The Survival Test
Drawdown is where theory meets psychology. It measures how much your equity declines from peak to trough. In crypto, drawdowns arrive faster and feel sharper than in slower markets.
There are two versions worth tracking. Absolute drawdown shows worst-case damage. Rolling drawdown shows how often you dig yourself into holes. A strategy with moderate net profitability but frequent deep drawdowns is mentally expensive to trade and often unsustainable.
Drawdown also exposes position sizing mistakes. Many traders think their risk is fixed, but volatility regimes change. What was safe last month may be aggressive this month. Drawdown catches that mismatch before the account blows up.
Fees and Funding: The Quiet Tax on Edge
Crypto traders underestimate how much fees and funding shape their results. A strategy that looks profitable before costs can be mediocre or losing after them.
High-frequency scalping magnifies fee impact. Holding positions across funding intervals magnifies funding impact. These costs do not feel dramatic trade by trade, but they drag expectancy down over time.
Tracking gross vs net performance is non-negotiable. If the gap between them widens, your strategy or execution style needs adjustment. Ignoring this is how traders slowly bleed edge without realizing why.
These core metrics form the backbone of meaningful performance analysis. They explain outcomes without overloading you with noise. Once these are stable and understood, you can move deeper into execution-level metrics that expose more subtle leaks. That’s where real improvement usually happens.
Execution Metrics That Expose Leaks
Once your core metrics are stable, the next layer is execution. This is where most profitable-but-inconsistent crypto traders discover what is actually holding them back. These metrics don’t just describe outcomes. They expose decision quality under pressure.
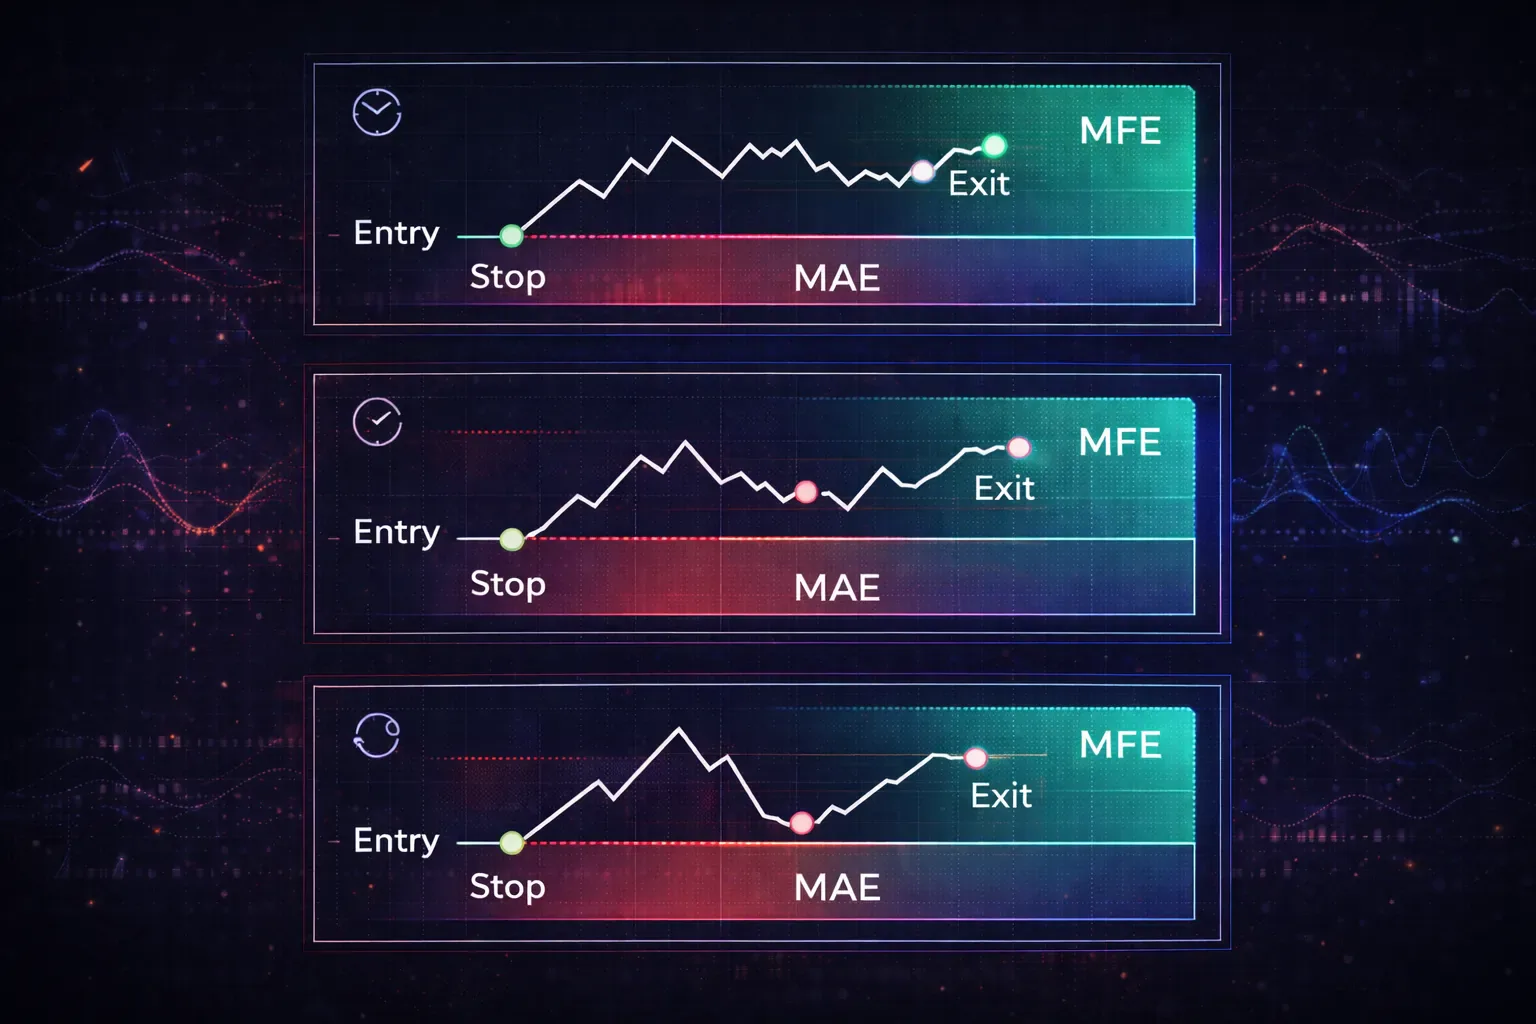
MAE and MFE: See Entries and Exits Clearly
MAE (Maximum Adverse Excursion) shows how far a trade moves against you before it closes. MFE (Maximum Favorable Excursion) shows how far it moves in your favor. Together, they tell a very honest story about your entries and exits.
In crypto, MAE often reveals whether you are entering too early or sizing too aggressively. If MAE is consistently large relative to your stop, you are probably anticipating moves instead of reacting to confirmation. That might work in low volatility conditions, but it gets punished during liquidation-driven spikes.
MFE, on the other hand, exposes exit behavior. Many traders see healthy MFE but mediocre realized profit. That gap means you are giving back open profit. Maybe you’re exiting at fixed targets while the market trends. Maybe you hesitate during fast moves because you’re afraid of reversals. The data doesn’t judge. It just shows what actually happens.
When you compare MAE and MFE across setups or tags, patterns jump out fast. Some setups tolerate more heat. Others don’t. Some deserve wider exits. Others need faster profit-taking. Without these metrics, those nuances stay invisible.
Slippage and Spread: The Fill Reality Check
Crypto traders love to assume their fills are clean. In reality, slippage creeps in during fast markets, low-liquidity hours, and news events. Even small slippage compounds when you trade size or frequency.
Tracking average slippage by symbol and session can explain sudden drops in expectancy. A strategy that works perfectly during high-liquidity periods may quietly fail during weekends or late Asia hours. The chart looks the same. The fills are not.
Spread sensitivity matters even more for scalpers. If your edge is a few ticks, widening spreads can erase it instantly. This is one reason identical strategies behave differently across exchanges like Binance, Bybit, or OKX.
Time in Trade: Catch Strategy Drift
Time in trade sounds simple, but it exposes a common crypto mistake. Traders plan short holds, then stay in longer because the market keeps moving or because funding feels negligible. Over time, that behavior shifts a strategy without the trader noticing.
If average time in trade drifts upward, ask why. Are exits unclear? Are you hoping instead of executing? Are you turning day trades into pseudo-swing trades without adjusting risk?
In crypto, longer holds increase exposure to funding, regime shifts, and random volatility. Time-based metrics help you catch that drift before it becomes a habit.
Session Performance: Trade The Hours You’re Built For
Crypto trades 24/7, but not all hours are equal. Liquidity, volatility, and behavior change dramatically between Asia, London, and New York sessions. Many traders unknowingly perform well in one session and poorly in another.
Session stats often reveal overtrading during dead hours or emotional trading during overlaps. A trader might be consistently profitable during New York open but give it back overnight. Without session segmentation, the week looks flat. With it, the fix becomes obvious.
Weekend Behavior: Spot The Weak Regime
Weekends deserve special attention. Liquidity thins out. Moves can be slower or suddenly violent. Many strategies degrade here, especially breakout and momentum-based ones.
If your weekend expectancy is negative, the solution might be simple. Trade smaller. Trade differently. Or don’t trade at all. The point is that the data gives you permission to make that call without guilt.
These metrics don’t just describe outcomes. They expose decision quality under pressure.
Advanced execution metrics turn vague frustration into specific insight. They don’t tell you what kind of trader you should be. They show you what kind of trader you already are. Once you see that clearly, adjustment becomes much easier.
A Realistic Scenario: Profitable, But Not Stable
Consider a trader who day trades SOL and ETH perpetuals on OKX and Binance. On paper, things look fine. Over three months, the account is up just over 9%. Win rate sits around 58%. There are no obvious blowups. From the outside, this looks like progress.
But the trader feels constantly on edge. Some weeks feel clean and controlled. Other weeks feel chaotic, even when they end green. The equity curve rises, but confidence doesn’t. That disconnect is usually the first signal that surface metrics are hiding something.
When the trader breaks performance down beyond net PnL, a clearer picture forms.
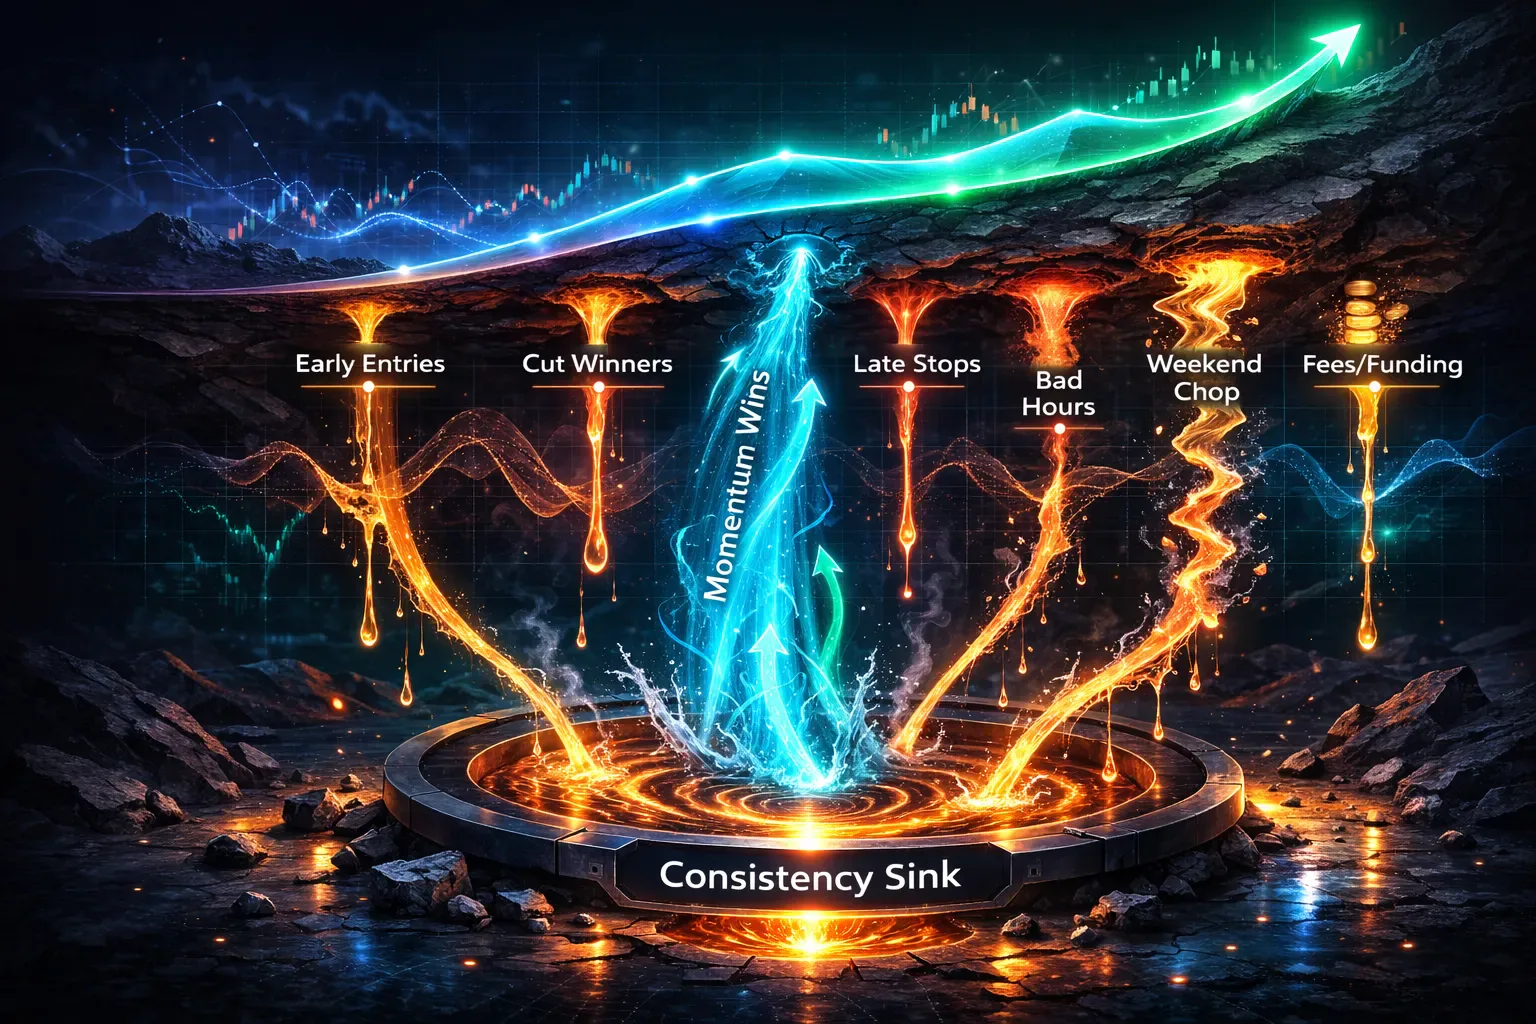
Expectancy is barely positive. Most of the profit comes from a handful of trades that caught strong momentum moves during high volatility. The average win is decent, but the average loss is creeping higher month over month. Drawdowns are shallow but frequent, which means the trader is constantly digging out of small holes.
Looking deeper into execution metrics reveals the core issue. MAE is consistently high relative to planned risk. Entries are early, often before confirmation, especially during New York open when volatility spikes. The trader is trying to anticipate moves instead of letting them develop.
MFE tells another part of the story. Many trades move significantly in favor, but realized profits capture only a fraction of that potential. Winners are cut quickly, while losers are given more room “just in case.” The result is a skewed payoff profile that relies on occasional outsized wins to stay profitable.
Session data sharpens the diagnosis. New York session performance is solid. Asia session performance is negative. Most of the losses come from late-night trades taken out of boredom or fear of missing moves. Weekends are slightly negative as well, mostly due to chop and poor follow-through.
Nothing here is dramatic on its own. That’s the point. These are slow leaks, not explosions.
Once the trader sees this, adjustments become obvious and manageable. Asia session trades are reduced significantly. Risk is scaled down during weekends. Entry rules are tightened to reduce early positioning, which lowers MAE almost immediately. Exit rules are adjusted to allow partials to run when MFE expands quickly.
Over the next six weeks, net PnL improves modestly. The bigger change is consistency. Expectancy rises. Drawdowns smooth out. The trader reports feeling calmer and more in control, even during losing days. The process starts to feel repeatable instead of fragile.
This is what metrics are supposed to do. Not motivate. Not impress. They clarify reality. When you see where your edge actually comes from and where it leaks away, improvement stops being emotional and starts being mechanical.
Turn Metrics Into a Journal Routine
All of these metrics sound useful in theory, but they only create real change when they fit into a repeatable workflow. This is where many traders fall apart. They understand the numbers, but they don’t know how to work with them consistently without turning reviews into a chore.
A practical workflow starts with structure. Each trade needs context. Not just the entry and exit, but the reason it was taken, the conditions it was taken in, and how it was managed. That context is what turns raw metrics into insight.
Tags are usually the first layer. You might tag by setup, by mistake, by market condition, or by emotional state. Over time, metrics can be filtered through those tags. Expectancy by setup. MAE by mistake tag. Drawdown by session. Patterns that are invisible at the account level become obvious when sliced this way.
Notes add another layer. Metrics tell you what happened. Notes explain why. A trade with high MAE might make sense if volatility expanded suddenly. Another with the same MAE might be pure impatience. Without notes, those two trades look identical in the data. With notes, they don’t.
Reports tie everything together. Weekly and monthly views show whether changes are actually working. If you tighten entry rules and MAE drops, you should see it reflected in expectancy and drawdown. If you stop trading low-quality sessions, session-based performance should clean up. The feedback loop becomes tight and objective.
Automation matters more than most traders realize. Manually logging trades often leads to missing data, especially during busy or emotional sessions. When trades are imported automatically and synced continuously, reviews are based on reality, not memory. That reliability is what allows you to trust the conclusions you draw.
This is where a crypto-specific journal like TradeChainly fits naturally into the process. Automatic imports from exchanges, combined with tagging, notes, and performance reports, make it possible to analyze metrics without spending hours in spreadsheets. The goal is not more data. It’s cleaner feedback with less friction.

The most important part of the workflow is consistency. Metrics only become meaningful when reviewed regularly. Not obsessively, but deliberately. When the same questions are asked each week, the data starts answering them clearly.
Build a Review Routine That Actually Changes Results
Having good metrics is useless without a review routine that keeps you honest and focused. The goal is not to analyze everything. It’s to review the right things at the right frequency, so adjustments are based on evidence instead of emotion.
Start by separating daily awareness from weekly and monthly analysis. Daily reviews should be light. You are not looking for conclusions. You are looking for red flags. Did risk per trade change? Did MAE spike? Did you trade outside your planned sessions? These checks prevent bad habits from compounding.
Weekly reviews are where most improvement happens. This is where expectancy, average win versus loss, and drawdown patterns start to mean something. One week is usually enough data to see whether execution slipped or improved. It’s also close enough to the trades that you still remember the context behind the numbers.
Monthly reviews are for structural decisions. This is where you evaluate whether a setup still works, whether a session is worth trading, or whether a strategy needs to be retired or modified. Monthly data smooths out noise and shows whether changes made during the month actually held up.
A useful review always starts with questions, not conclusions. Instead of asking “Did I make money?” ask “Where did my edge come from this period?” and “Where did it leak?” Metrics should answer those questions directly. If they don’t, you are probably tracking the wrong ones.
One common mistake is trying to fix too many things at once. Metrics often reveal multiple issues, but improvement comes from focus. Pick one adjustment per review cycle. Tighten entries. Reduce a session. Adjust exits. Then let the data respond before changing something else.
Another trap is using metrics as self-judgment. Losing weeks happen even with clean execution, especially in crypto. A good routine distinguishes between bad trading and bad outcomes. If process metrics look solid, the response is patience, not rule changes.
Over time, this routine creates trust. You stop reacting to every drawdown or winning streak. You know what the data means, how quickly it responds, and which levers actually move performance. That confidence is hard to build any other way.
Close: Make The Data Work For You
Most crypto traders don’t fail because they lack effort or motivation. They fail because they never get clear feedback on what their trading is actually doing. Surface stats like win rate and net PnL feel informative, but on their own they hide more than they reveal.
When you shift toward performance metrics that separate process from outcome, everything changes. Losses stop feeling random. Winning streaks stop feeling fragile. You can see where your edge comes from, where it leaks, and which behaviors deserve reinforcement or correction.
Crypto markets make this level of clarity even more important. Leverage compresses mistakes. Funding and fees quietly tax sloppy execution. Volatility rewards discipline and punishes hesitation. Without the right metrics, you end up reacting emotionally to outcomes instead of responding intelligently to patterns.
The goal of tracking metrics is not to turn trading into a math exercise. It’s to reduce guesswork. When you know which numbers matter and how they behave over time, decisions become calmer and more deliberate. You stop chasing fixes and start making adjustments that compound.
A trading journal is what makes this sustainable. When trades are captured automatically, tagged consistently, and reviewed through the lens of meaningful metrics, improvement becomes part of the routine instead of a sporadic effort. Tools like TradeChainly exist to support that process, not to replace judgment, but to give it better information.
If you want to trade crypto seriously over the long term, performance tracking is not optional. Look at your last 100 trades and ask a better question than “Did I make money?” Ask “Where did my edge actually come from, and where did I give it back?”