Turning Random Trade Logs Into Useful Feedback
Why do you keep “journaling” but still feel like you trade the same way month after month?
Most crypto traders start with good intentions. They open a spreadsheet or a notebook, write down a few trades, maybe add some notes, and assume improvement will follow. Weeks later, nothing has changed. The journal exists, but it does not actually help them trade better.
Structure is the issue.
A journal without structure becomes a record of the past. It stores information, but it does not create insight. When you look back, you cannot answer meaningful questions. You cannot see which setups work, whether your mistakes repeat, or whether losses come from entries, risk management, or emotions. Everything is mixed together.
Many traders confuse “tracking trades” with “analyzing performance.” They log entries and exits, maybe profit and loss, and stop there. That tells you what happened, not why it happened or how to improve it.
Structure forces consistency. Every trade becomes comparable data. Patterns show up, and you get a feedback loop between decisions and results.
In crypto, volatility is high. You may trade both spot and futures. Fees, funding, leverage, and execution quality all affect outcomes. Without structure, your journal becomes a mix of numbers that never connect.
If your journal cannot answer these questions, it is not doing its job: Why do I lose money on certain pairs but not others? Which setups actually produce my best returns? Do I perform worse when I trade during low liquidity hours? Are my losses coming from bad entries or from holding losers too long?
A good template solves that. It creates a repeatable framework that turns raw trade data into performance insight.
Building a Template That Forces Consistent Thinking
When traders hear “template,” they often imagine a rigid spreadsheet with too many columns. A template is about consistency of thinking.
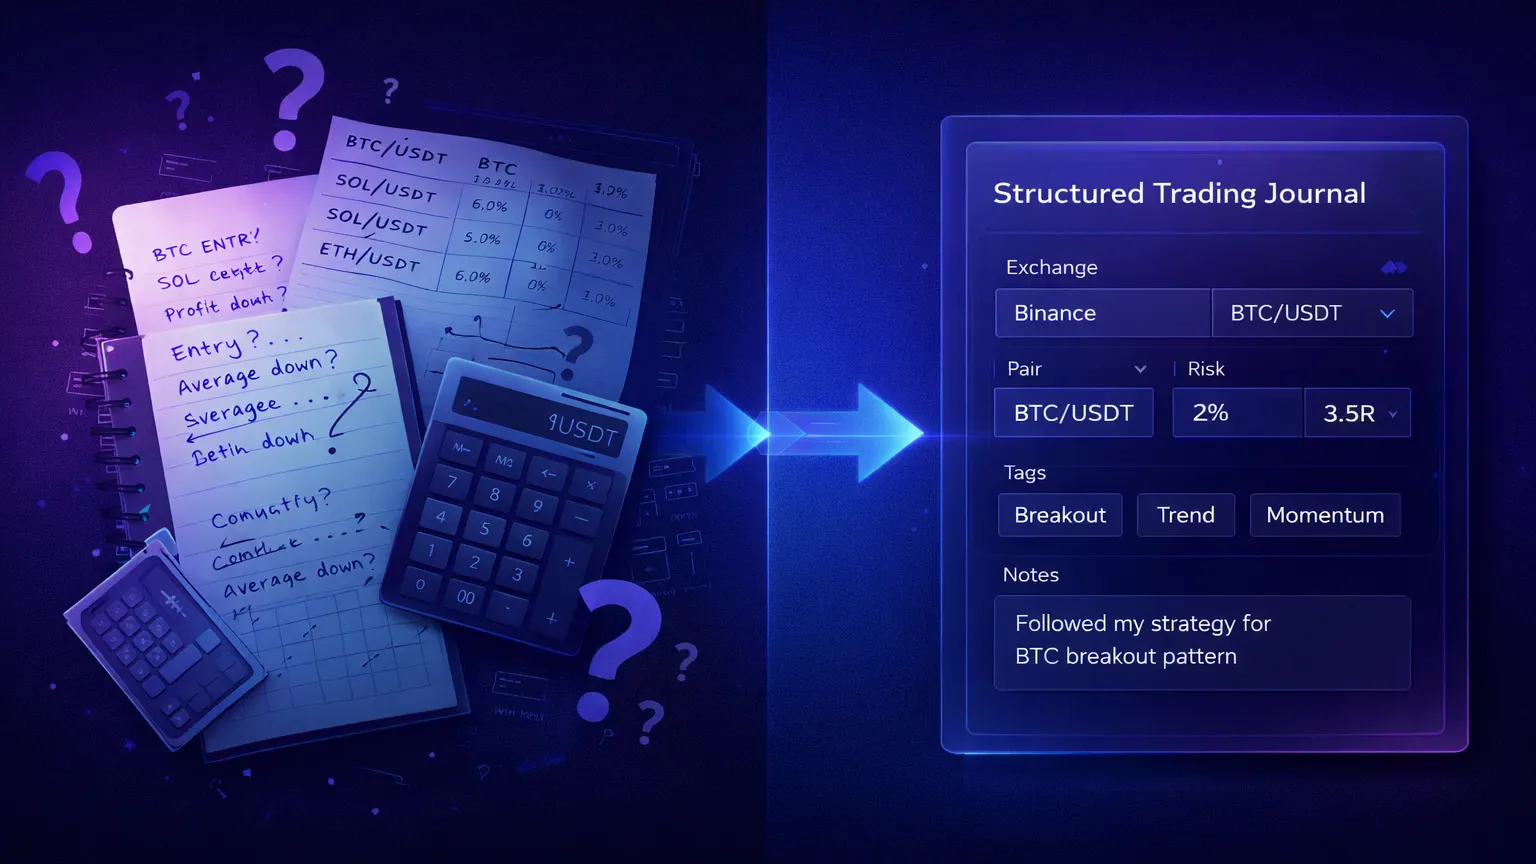
A trading journal template is a decision framework. It defines what information matters, how to record it, and how to evaluate trades afterward. It removes randomness from journaling and replaces it with structure.
Every trade is an experiment. If you do not record the same variables each time, you cannot compare results or isolate cause and effect. Random notes fail for the same reason. One day you write about emotions, another day about price action, another day nothing at all. Over time, inconsistency kills analysis.
A good template solves three problems: it standardizes your data so trades are comparable, it forces clarity because setups and mistakes have names, and it creates a review system because structured data is fast to scan.
Crypto adds extra reasons to be strict. Exchanges have different fee structures. Spot and futures behave differently. Funding, leverage, and liquidation risk change how trades behave, and volatility can hide bad execution behind lucky profits. A proper template captures those differences. It does not just record profit. It records how that profit was made.
Layering Your Journal So Analysis Stays Clean
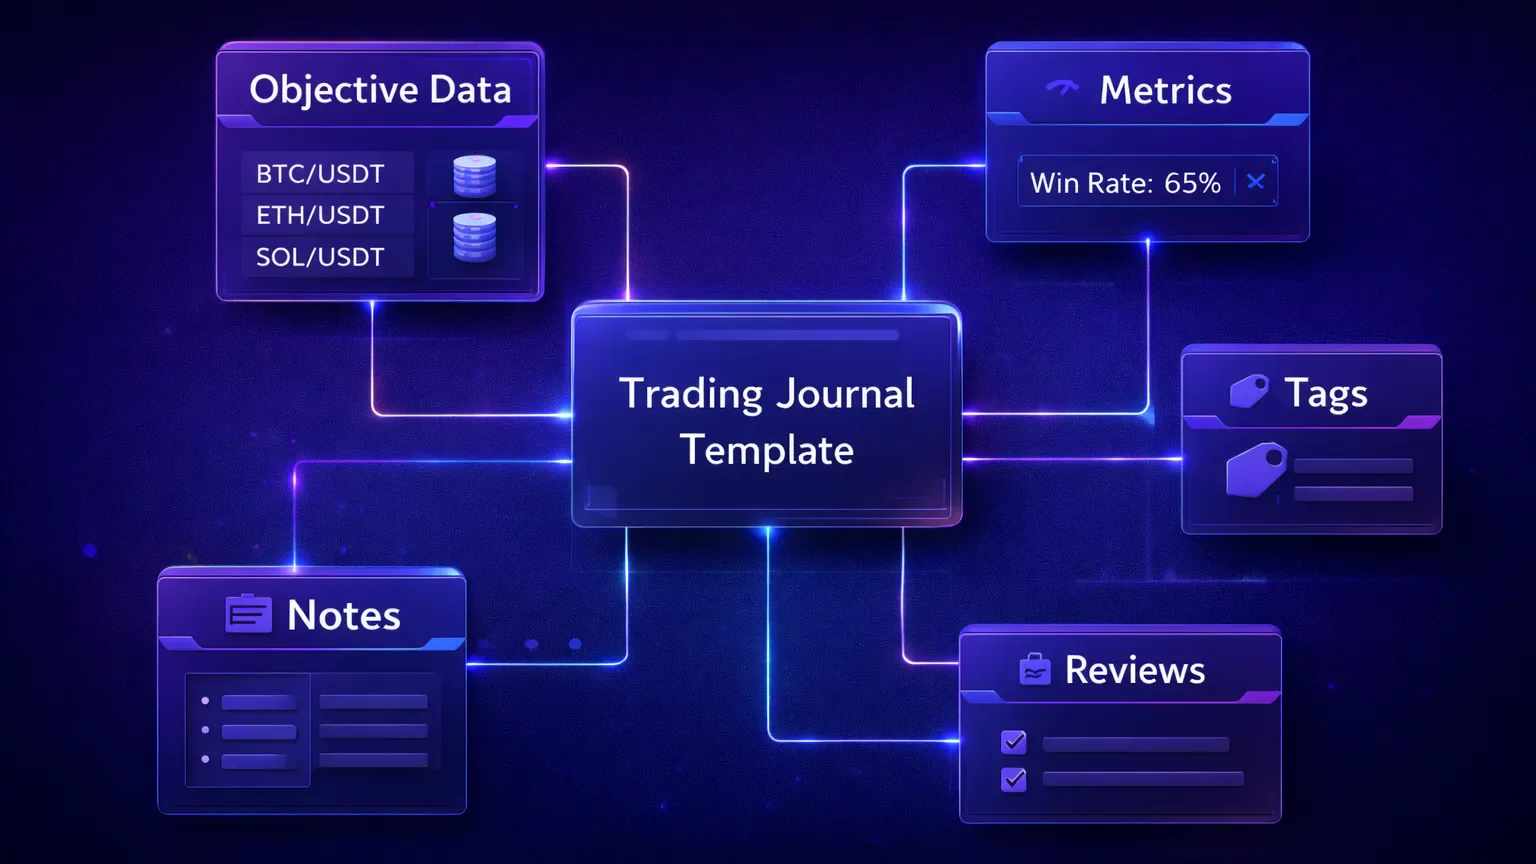
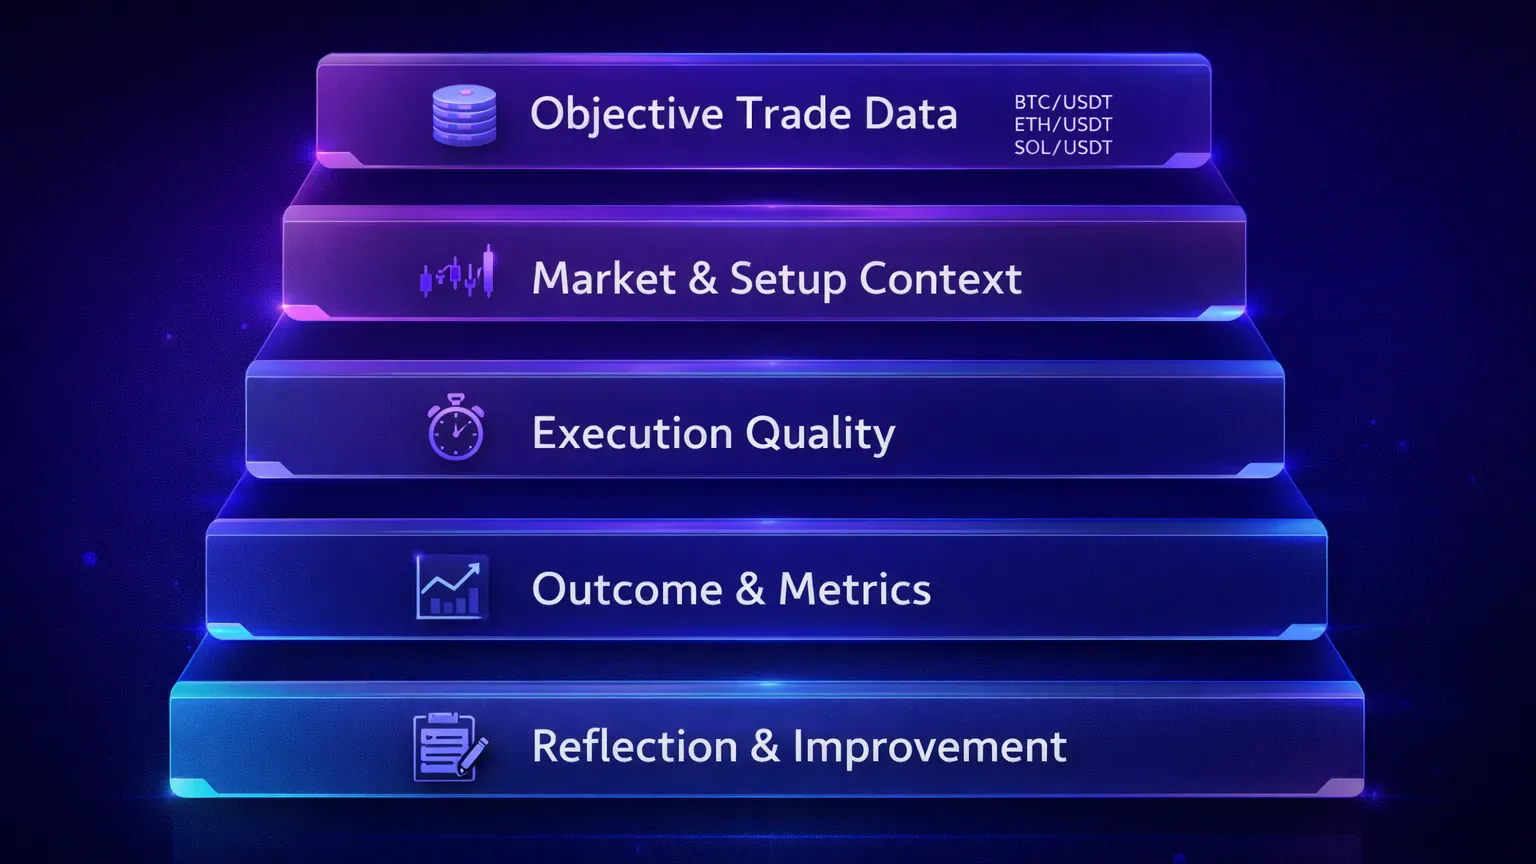
A powerful journal template is built in layers. Each layer answers a different question about your trading. Separation of purpose lets you analyze one dimension at a time.
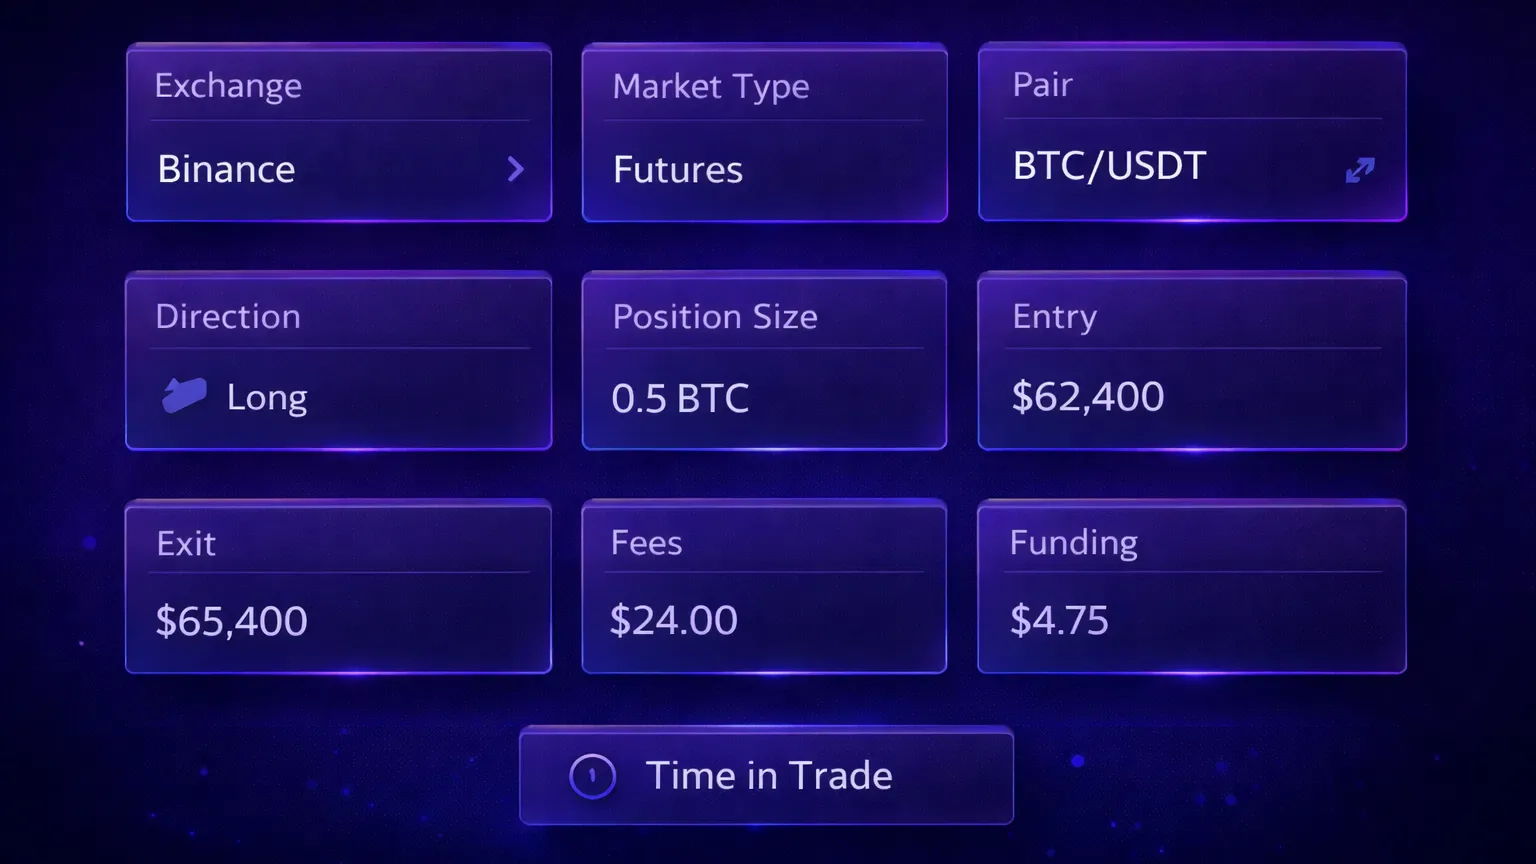
Start with objective trade data. This answers “What did I trade and how?” Record exchange, market type (spot or futures), trading pair, direction, position size, entry and exit prices, and fees and funding. This data must be factual. No interpretation. No emotion. Just reality.
Add market and setup context to answer “Why did I take this trade?” Record setup type, timeframe, market condition, and the technical or structural reason for entry. Without this, you cannot separate luck from skill.
Track execution quality to answer “How well did I execute my plan?” Note whether the entry followed rules, whether position size was correct, whether you respected stops, and whether emotions interfered. Two traders can take the same setup and get the same result. One executed perfectly. The other broke rules. Your journal must show that difference.
Then record outcome and metrics to answer “What was the result in performance terms?” Include profit or loss, R-multiple, drawdown contribution, and risk-adjusted outcomes. Profit alone is not enough. You want to know if the decision was statistically good.
Finally, write reflection and improvement to answer “What do I change next time?” Progress happens here, but without the earlier layers reflection turns into emotional guessing.
| Layer | Purpose | Example Data |
|---|---|---|
| Objective Trade Data | Capture factual trade details | Binance, BTCUSDT, Futures, Long, 0.5 BTC, Entry 42,300, Exit 42,900 |
| Market & Setup Context | Explain trade reasoning | Breakout retest, 15m timeframe, trend continuation |
| Execution Quality | Evaluate discipline | Entry followed plan, stop respected, no early exit |
| Outcome & Metrics | Measure performance | +1.8R, +0.9%, low drawdown impact |
| Reflection & Improvement | Identify adjustment | Improve patience on entry timing |
Capturing the Trade Data That Never Changes
Every journal template begins with objective trade data. This is non-negotiable. If this layer is missing or inconsistent, nothing above it matters.
In crypto trading, certain details are especially important because they change how a trade behaves and how performance should be interpreted.
Always record the exchange. Binance, Bybit, OKX, Coinbase, Kraken, and others all have different fee structures, liquidity profiles, and execution characteristics. If you do not track this, you will never know if one platform performs worse for you than another.
Record market type. Spot and futures are different businesses. A profitable spot strategy can be disastrous on futures. You must record whether the trade was spot or derivatives.
Record the trading pair because pairs behave differently. BTC, ETH, and altcoins have unique volatility patterns, and your journal should allow filtering by pair.
Direction matters for performance breakdowns. Position size matters because profit and loss has no context without it. Entry and exit prices define execution quality, and over time you will see whether your entries are consistently late or your exits are consistently early.
Fees are not small at scale. Ignoring them hides real performance. Funding, for futures, can turn a flat trade into a loser or a small win into a larger gain, so track it separately. Time in trade reveals behavior. Short holds show scalping tendencies. Long holds show swing bias. It also exposes overtrading.
Once this is stable, everything else becomes meaningful.
Turning Trades Into Insight With the Right Metrics
Recording trades without metrics is like collecting raw price data without ever calculating returns. You can see what happened, but you cannot evaluate whether your decisions are improving.
Metrics translate individual trades into a system-level view of your trading.
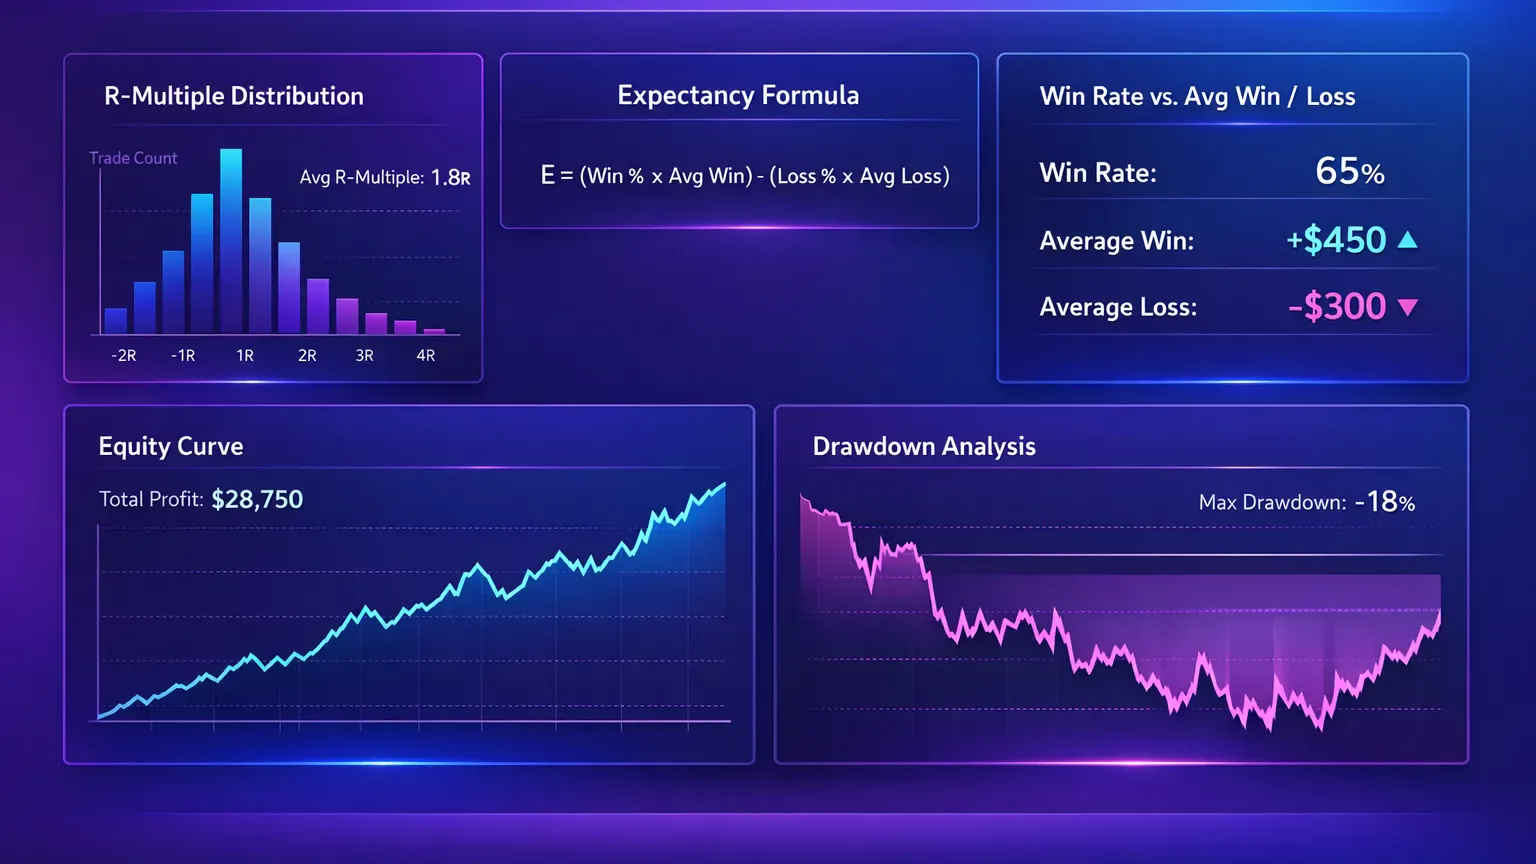
R-multiple measures how much you gained or lost relative to what you risked. If you risk $100 and make $200, that is +2R. If you lose $100, that is -1R. This makes trades comparable regardless of size.
R matters because it shows whether your strategy is structurally profitable. A trader with a 40 percent win rate can be profitable if their average win is larger than their average loss. Without R, most traders misjudge their own edge.
Win rate alone is misleading. High win rate strategies often hide poor risk management. Expectancy combines win rate and R into a single value:
Expectancy = (Win rate × Average win) - (Loss rate × Average loss)
If this number is positive over enough trades, your system works. If it is negative, it does not matter how confident you feel.
Average win versus average loss tells you whether your risk control is healthy. Many losing traders have average losses that are two or three times larger than their average wins. Your journal exposes this immediately.
Drawdown awareness shows whether your risk profile matches your psychology. A strategy with high returns but massive drawdowns often fails in real trading.
MAE and MFE are optional but powerful. Maximum Adverse Excursion shows how far price went against you before the trade resolved. Maximum Favorable Excursion shows how much profit was available at peak. These metrics reveal whether your stops are too tight or your exits are too early. Not every trader needs MAE and MFE from day one. But once your journal matures, they become extremely useful.
| Metric | Definition | Why It Matters |
|---|---|---|
| R-multiple | Profit or loss divided by initial risk | Standardizes performance across all trades |
| Expectancy | Average profit per trade | Shows if your system is profitable long-term |
| Win Rate | Percentage of winning trades | Useful only when paired with R |
| Average Win | Mean profit of winning trades | Shows profit potential |
| Average Loss | Mean loss of losing trades | Shows risk control |
| Max Drawdown | Largest equity decline | Measures emotional and financial stress |
| MAE | Max move against trade | Evaluates stop placement |
| MFE | Max move in favor | Evaluates exit efficiency |
Metrics turn your journal into a mirror. They show what your strategy actually does, not what you think it does.
Building Tag Systems That Explain Performance
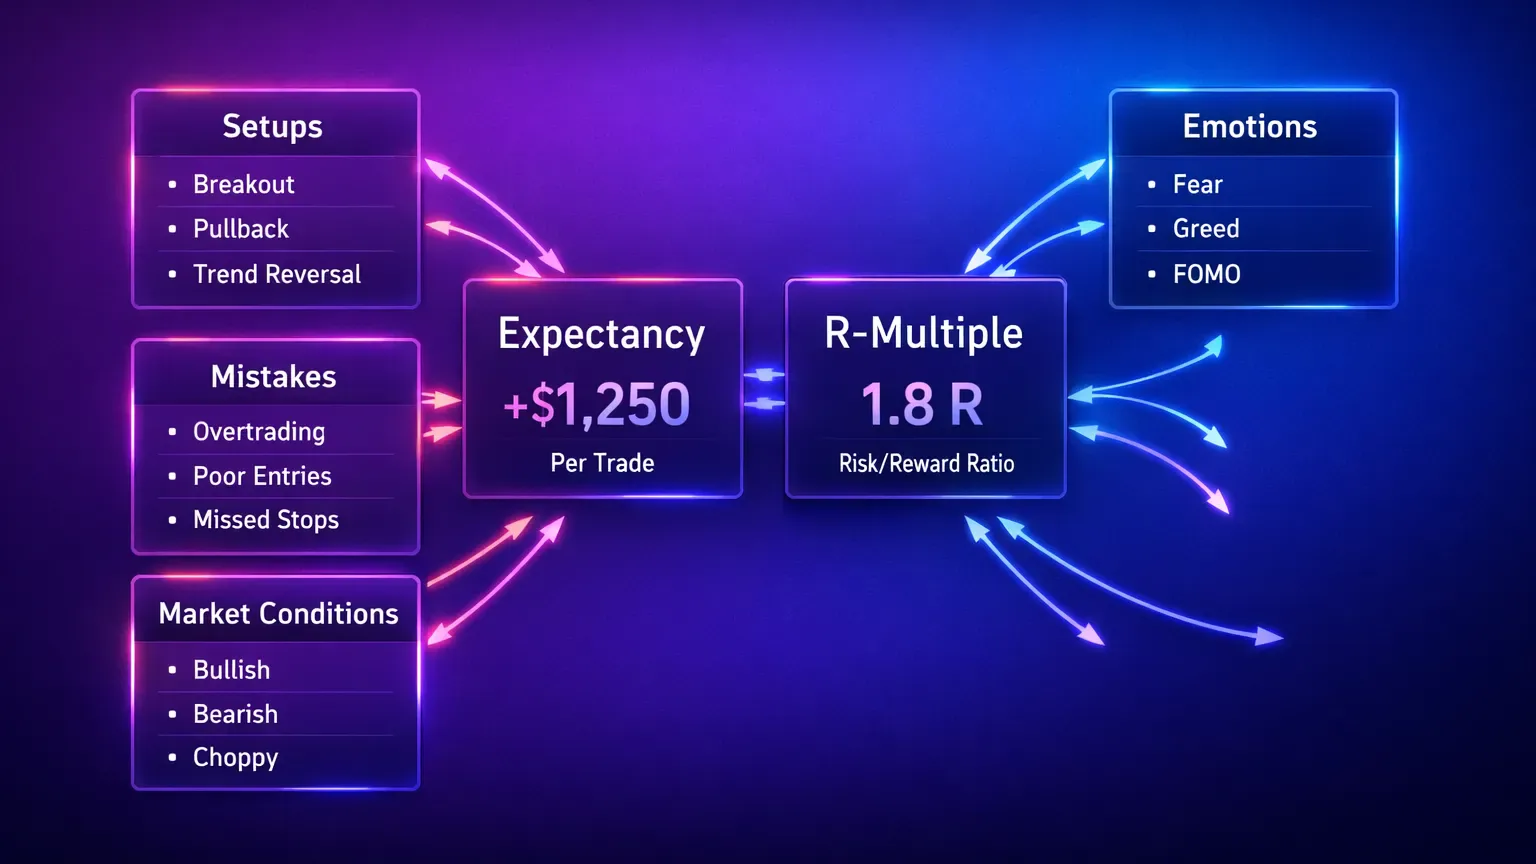
Metrics show performance. Tags explain performance.
Tagging lets you slice your data by behavior, decision type, and context. Without tags, your journal can tell you that you are losing money, but not why.
There are four main categories of tags that matter in crypto trading. Setup tags describe the type of trade you are taking, such as breakout, range rejection, trend continuation, mean reversion, or liquidity sweep. Mistake tags describe execution errors. Examples include chasing entries, moving stops, oversizing, revenge trading, or ignoring invalidation. Market condition tags describe the environment. Trending, ranging, high volatility, low volume, news-driven, or funding extremes. Many strategies only work in certain conditions. Tags make this visible. Emotional tags describe your state of mind. Overconfident, fearful, tired, impatient, or distracted. They connect psychology to outcomes without turning your journal into therapy.
Filtering is the point. You can ask: How does my breakout strategy perform during low volatility? Which mistakes cost me the most R over a month? Do I trade worse after three consecutive losses? Does fatigue correlate with oversized losses?
This is performance science, not a diary.
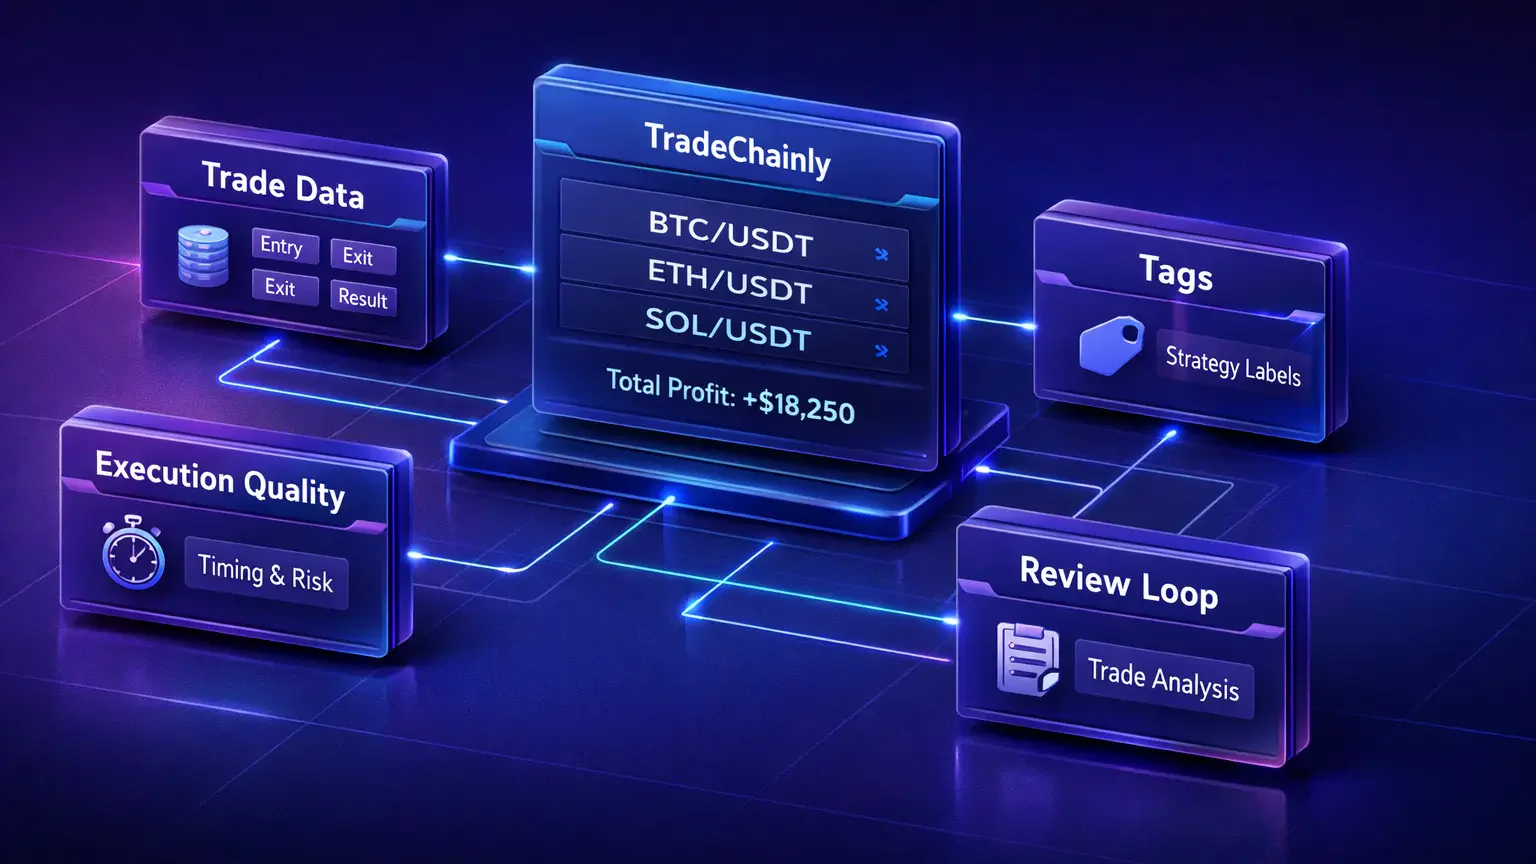
Platforms like TradeChainly make tagging practical because they allow you to assign, filter, and analyze tags across thousands of trades without manual spreadsheets. The idea matters more than the tool, but automation removes friction that causes most traders to stop journaling.
Writing Notes That Change Execution
Most trading notes are emotional. They say things like “I was nervous” or “I should have waited.” These statements feel honest but they rarely lead to improvement.
Effective notes are operational. They focus on decisions, rules, and execution.
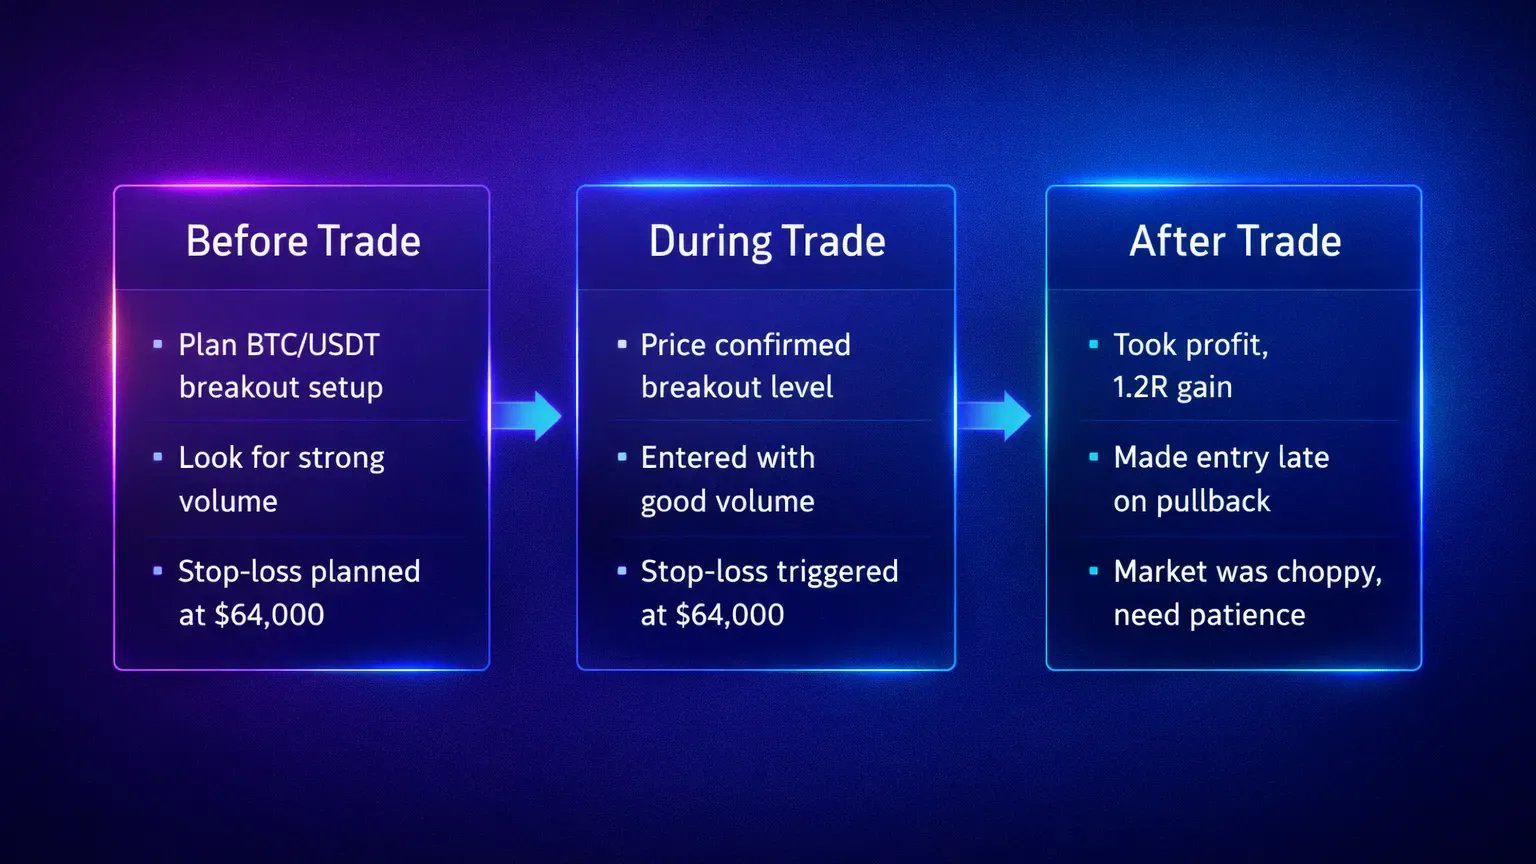
Before the trade, write what must be true for the trade to be valid. This clarifies intent. If the trade fails, you know whether the idea was wrong or the execution was wrong.
During the trade, note any deviations. Did you hesitate? Did you move a stop? Did you reduce size impulsively? These details explain results later.
After the trade, focus on process, not outcome. Ask: Did I follow my plan? Was my risk appropriate? Would I take this trade again?
Short, structured notes outperform long emotional paragraphs. Your journal is not a confessional. It is a performance logbook.
Adjusting the Template for Spot and Futures
One template can serve both spot and futures trading, but it must capture their differences.
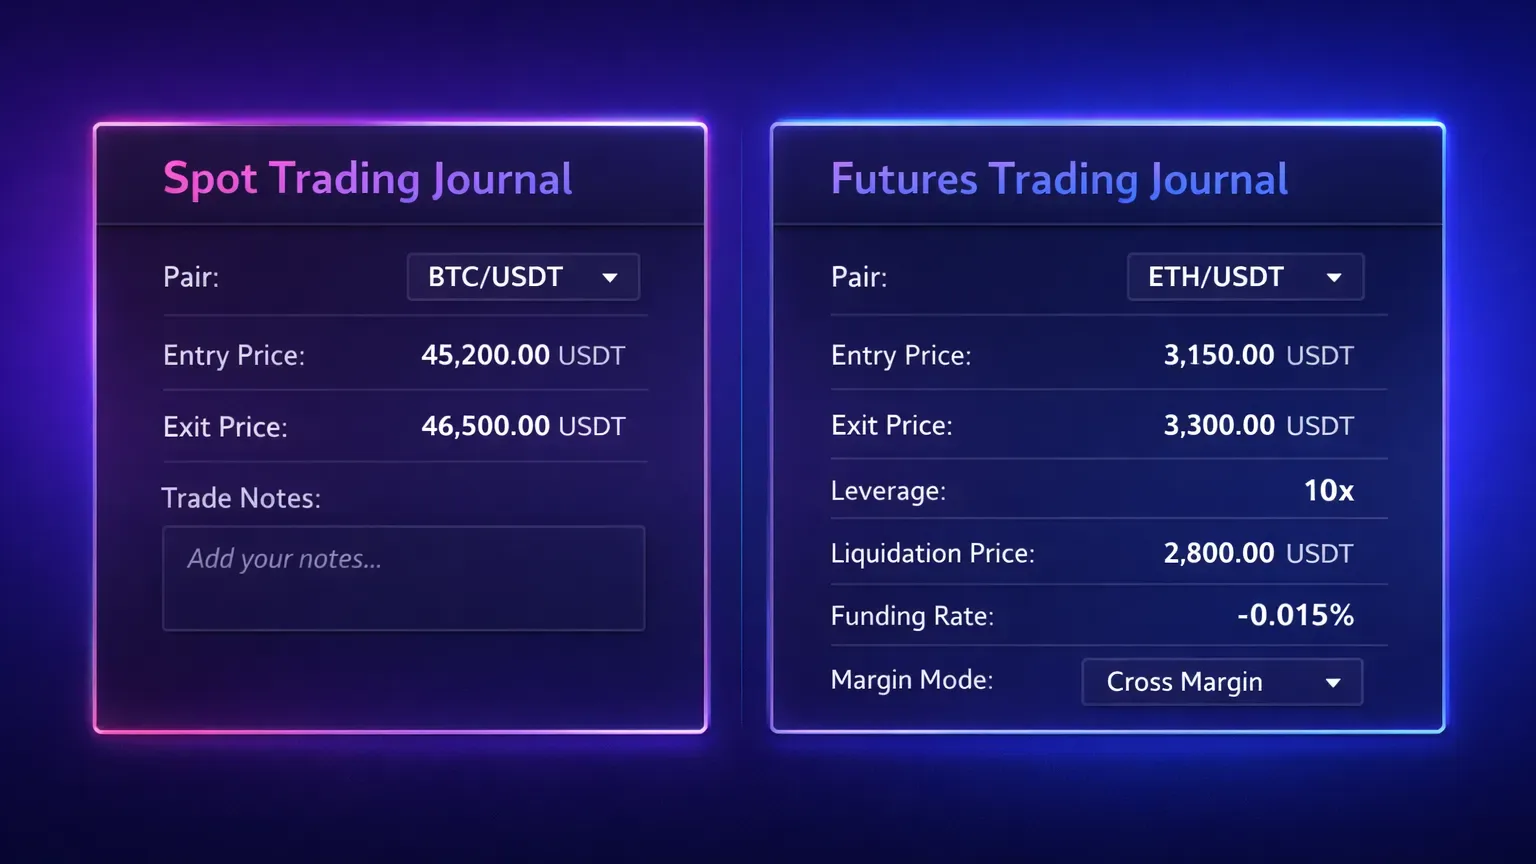
Spot trading is simpler. No liquidation. No funding. Risk is limited to capital deployed. Your template focuses on entry quality, exit logic, and position sizing efficiency.
Futures trading introduces leverage, liquidation risk, and funding. Your journal must record leverage used, liquidation price, funding paid or received, and margin mode.
A profitable futures trader with poor funding control can quietly bleed capital without noticing. This only shows up in a structured journal.
Risk expression is also different. A 1 percent account risk on futures behaves very differently than a 1 percent spot position. Your template must make that distinction visible.
Turning the Template Into a Daily Habit
A template only matters if it becomes routine.
After each trade, record data immediately. Do not wait. Memory distorts execution.
For a daily review, scan mistake tags and setup tags and look for repeated behavior. For a weekly review, check which setups are profitable and identify which mistakes cost the most R. For a monthly review, evaluate expectancy, drawdown, and emotional stability.
Automation helps here. TradeChainly’s continuous syncing and reporting remove the manual work that causes most traders to abandon journaling. The value is not the software. The value is consistency.
Avoiding the Template Mistakes That Kill Consistency
The biggest mistake traders make is trying to track everything. More data does not automatically mean better insight. If your template feels heavy, you will stop using it.
Focus on data that changes decisions. If a metric or field does not influence how you trade, remove it.
Another mistake is tracking data without reviewing it. Many traders collect hundreds of trades and never analyze them. A journal without review is just storage. The real value comes from patterns discovered during review sessions.
Inconsistent tagging is another common failure. If one day you tag a setup as “breakout” and the next day you call the same setup “momentum entry,” your data becomes fragmented. Decide on your categories early and stick to them.
Some traders treat journaling as punishment after losing days. That creates emotional resistance. Your journal should be neutral. It exists to learn, not to judge.
Finally, many traders mix emotional venting with performance analysis. Emotions matter, but they must be connected to decisions. Writing “I felt frustrated” is useless unless you link it to a specific mistake like revenge trading or oversizing.
Closing the Loop With One Clear Next Step
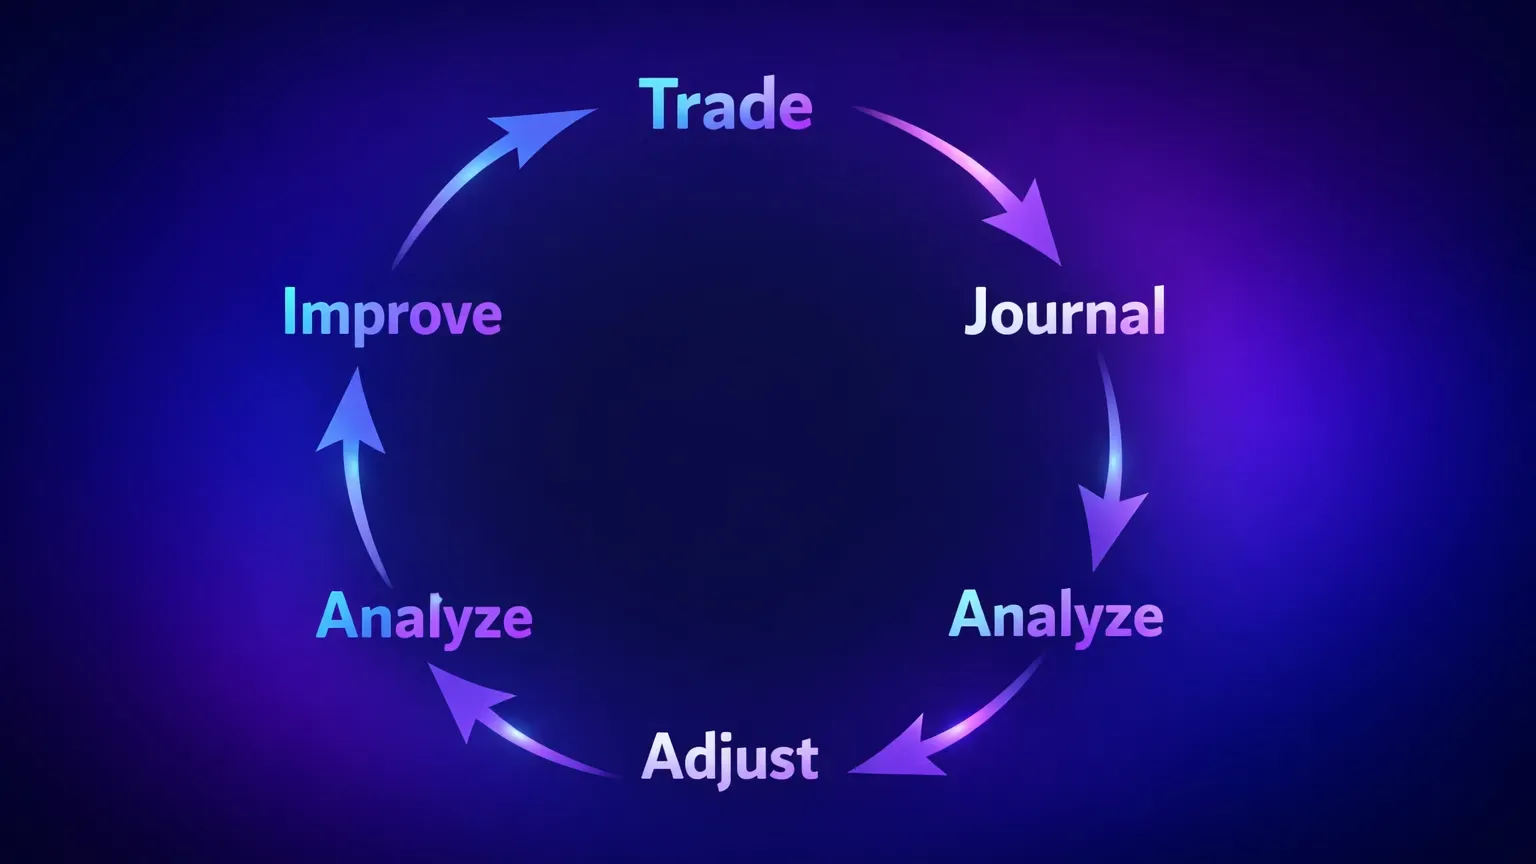
A crypto trading journal template is a system. It transforms scattered trades into structured feedback. It turns randomness into data and data into decisions.
Start simple. Track objective data. Add metrics that expose risk and expectancy. Use tags to explain performance. Write notes that focus on execution, not emotion. Review regularly and refine your template as your trading evolves.
When this process is automated, it becomes sustainable. Platforms like TradeChainly exist to remove friction from journaling through automatic trade imports, tagging, and reporting so your focus stays on learning instead of data entry. The goal is not software. The goal is a repeatable improvement loop.
Your journal should make you better.