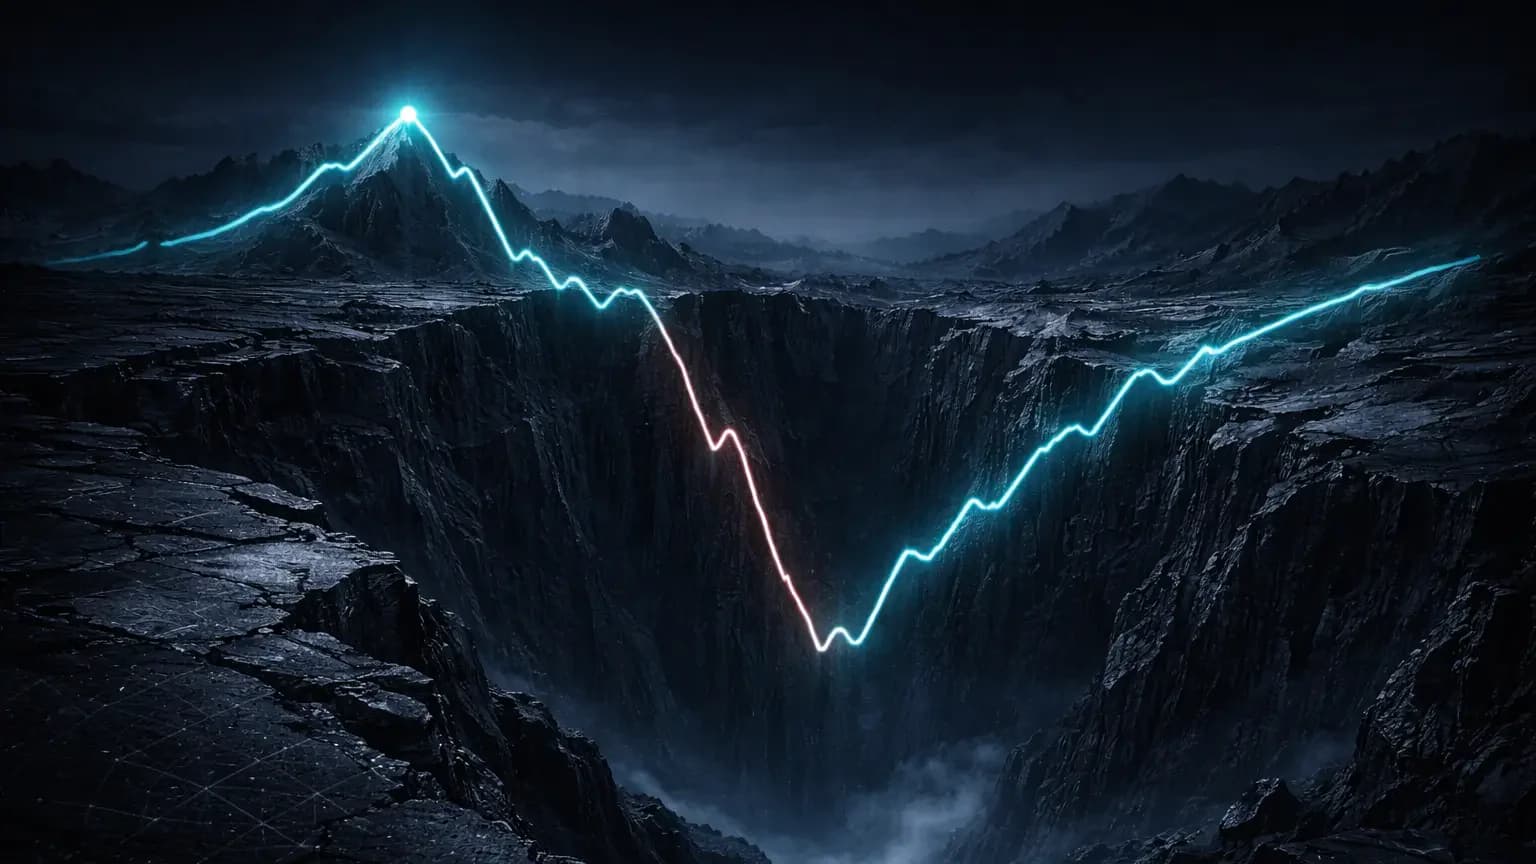
Why Most Crypto Traders Misunderstand Drawdown
High win rates destroy more crypto accounts than low ones. Not because winning is bad, but because traders stop respecting what happens during the losing stretches.
Drawdown is the number that exposes those stretches. If you trade crypto every day, you already know that losing streaks hit harder here than in most other markets. It is not just the money. It is the speed. Crypto moves fast, liquidity can thin out without warning, and leverage magnifies every mistake. One small slip can turn into a cascade that takes weeks to recover from.
Drawdown is not some academic risk term. It is the clearest way to measure how deep the hole gets when your trading hits a rough patch.
Most traders do not blow up because their strategy never works. They blow up because their worst periods get out of control. One bad session becomes three. A small loss becomes a funding drain. Size creeps up. Stops get wider. Emotions start driving execution.
Drawdown is how you quantify that spiral before it destroys your account.
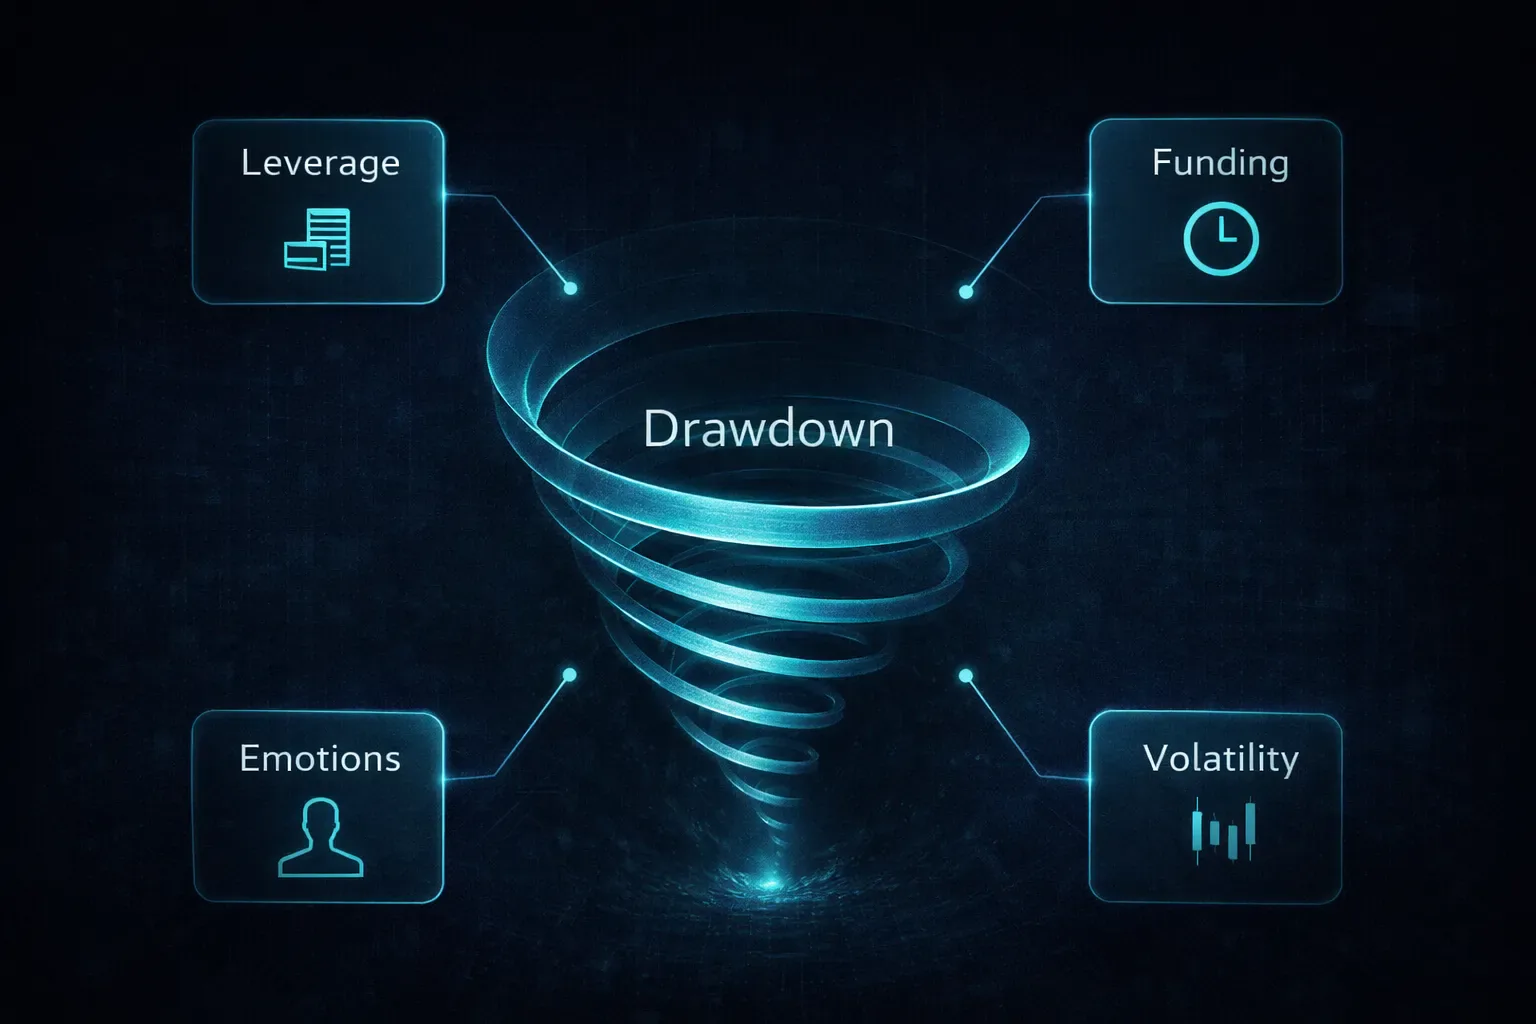
In crypto, this is even more important because:
- The market trades 24/7, so there is no natural “reset”
- Liquidation creates hard stop points that do not exist in traditional markets
- Funding rates can bleed an already losing position
- Altcoins can trend far beyond what seems reasonable
- Emotional FOMO and revenge trading are amplified by volatility
So if you want to become consistently profitable, it is not enough to know your win rate or PnL. You need to understand what happens when things go wrong. That is exactly what drawdown measures.
What Drawdown Measures in Practice
Drawdown simply measures how far your account falls from a high point to a later low point, before recovering again.
Imagine your equity curve. It climbs. Then you hit a losing streak. The curve slopes downward. The difference between the highest peak and the lowest point during that decline is your drawdown.
There are two main forms you should think about:
-
Balance drawdown
This only counts realized PnL. It changes after you close a trade. -
Equity drawdown
This includes unrealized PnL while trades are open.
Crypto traders should care about both, but equity drawdown often hurts more because unrealized losses still impact your psychology and liquidation risk.
Here is the idea in simple language: Drawdown shows how bad your worst periods get.
Not your average loss.
Not your worst trade.
Your worst run of consecutive damage to the account.
Now visualize it.
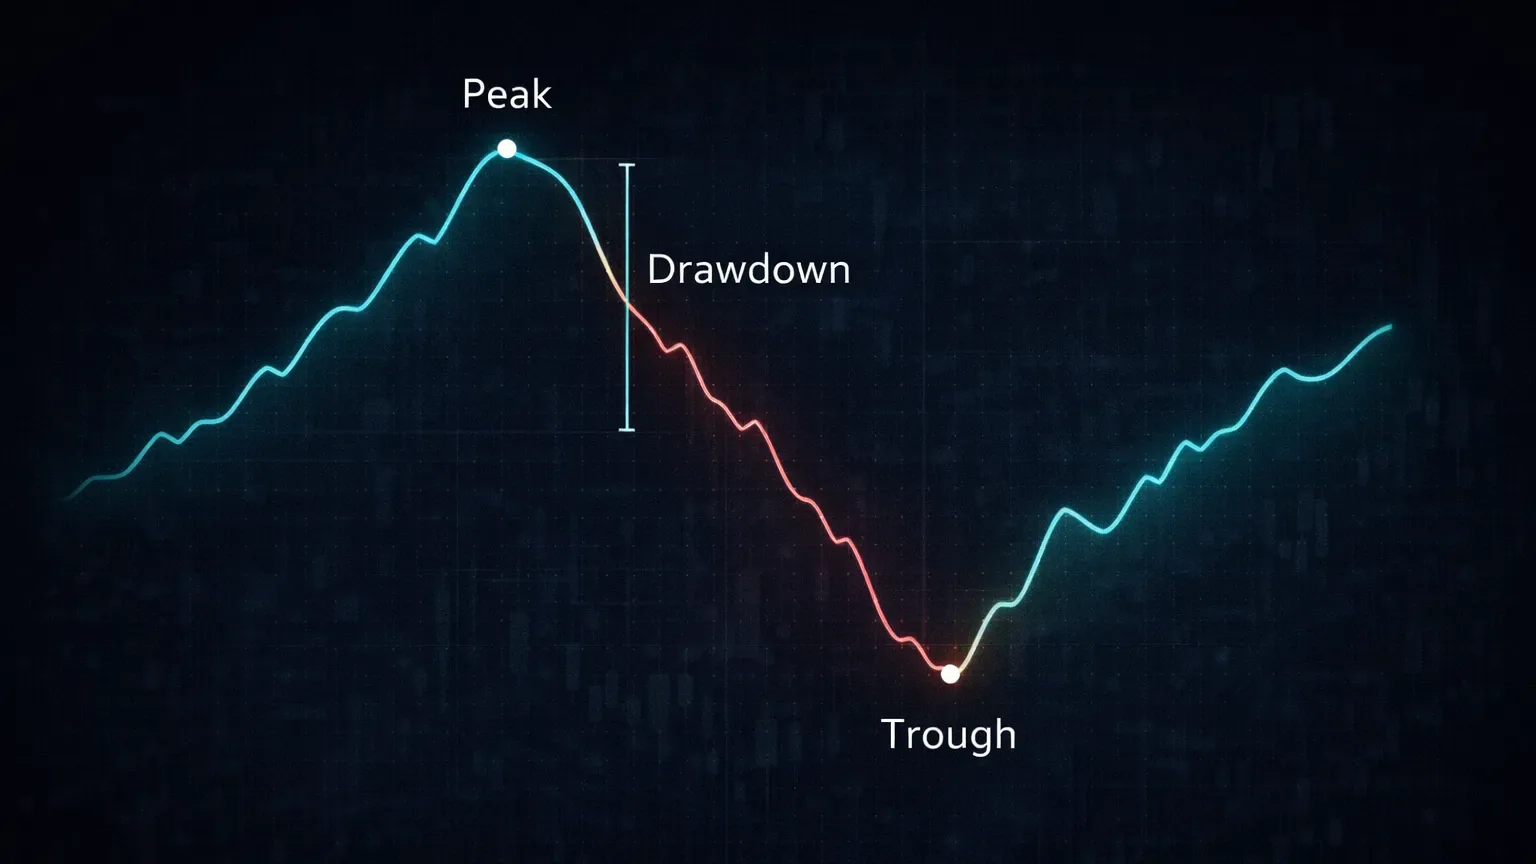
The line rises. Then it falls. The vertical difference between the peak and the bottom of that fall is your drawdown.
That is it. Simple idea. But the implications are massive, especially when you trade leveraged futures or perpetuals.
The Drawdown Math (Crypto Example Included)
Let’s walk through it slowly and cleanly.
Say your account hits a high of $10,000.
Then after a losing streak, it drops to $8,000.
Drawdown = (Peak - Trough) / Peak
Drawdown = ($10,000 - $8,000) / $10,000
Drawdown = $2,000 / $10,000
Drawdown = 0.20 or 20%
So your drawdown is 20%.
That tells you: Your account went down 20% from its peak.
Now let’s apply this to a realistic crypto futures scenario.
Assume a Binance USDT perpetual account.
Account peak: $12,500
After 9 trades, account low: $9,750
Drawdown = ($12,500 - $9,750) / $12,500
Drawdown = $2,750 / $12,500
Drawdown = 0.22 or 22%
So you are sitting in a 22% drawdown.
This includes realized losses only. If you had an open BTC short bleeding unrealized losses, your equity drawdown might be larger.
In crypto, unrealized drawdowns matter because:
- liquidation risk increases
- stress increases
- funding fees can increase total loss
- traders often panic close near the worst point
Now let’s separate two important ideas.
Current drawdown
Your drawdown right now relative to your previous peak.
Maximum drawdown
The worst drawdown you have ever experienced over a given period.
Maximum drawdown is what most serious traders track.
It answers the question: “How bad does it get when my strategy struggles?”
Here is a visual example to clarify it.
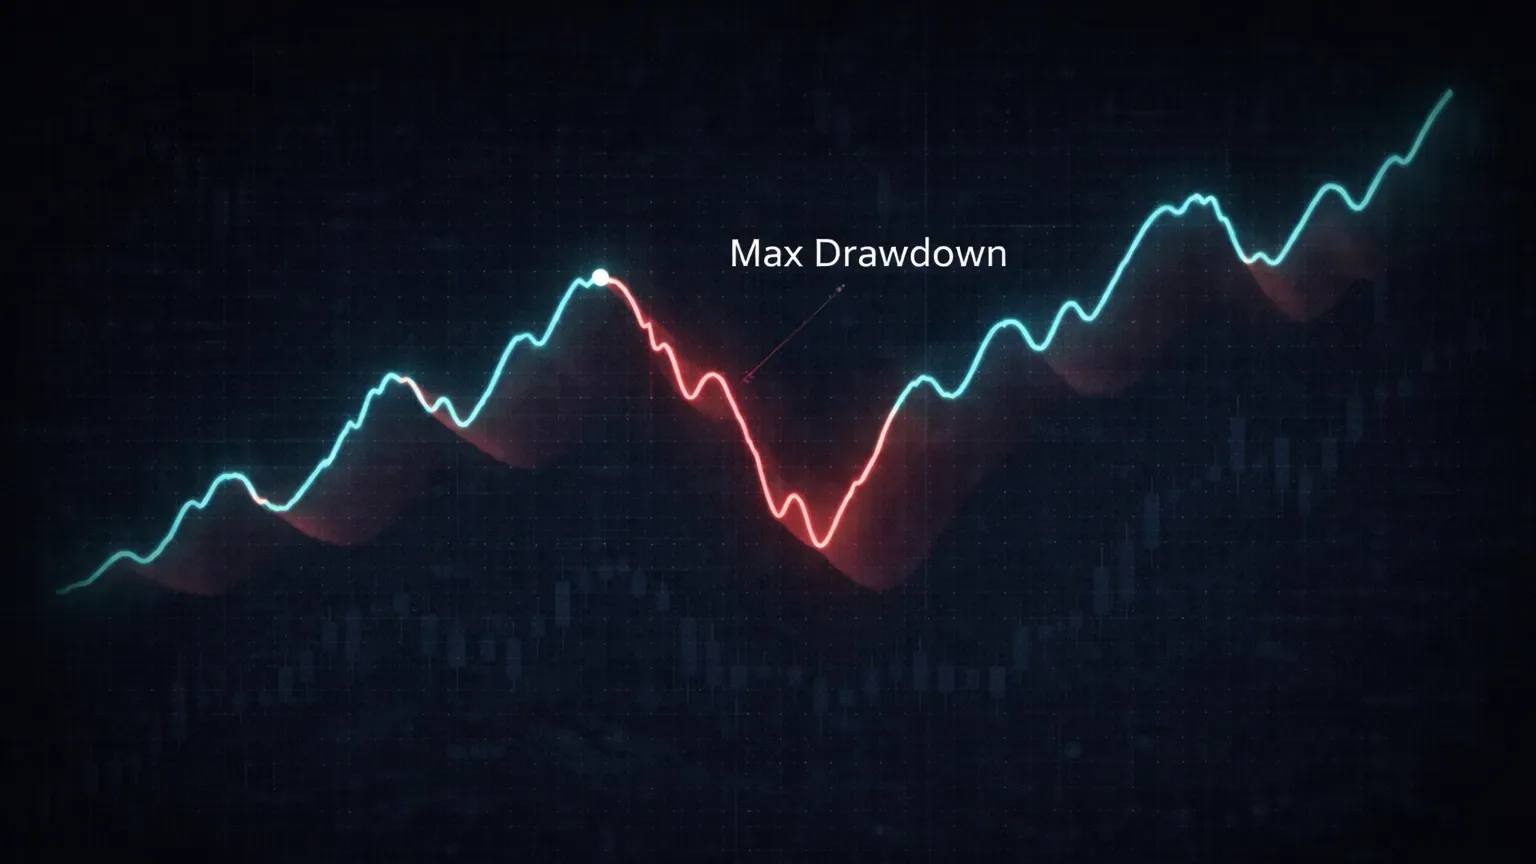
A crypto account makes new highs. Then pulls back. Then recovers. Each peak to trough decline is a drawdown. The largest one is your max drawdown.
Once you see it on a chart, the concept sticks. And it becomes almost impossible to ignore how important it is.
The Crypto Problem: Why Drawdown Feels Worse
Drawdown is always uncomfortable. But in crypto, it often feels twice as bad.
There are structural reasons for that.
The market never closes. So your brain never gets to shut down and reset. A losing streak can stretch across days without pause.
Leverage makes the swings sharper. A 1% move with 20x leverage is a 20% equity change if you are fully sized. That intensifies every fluctuation and magnifies errors.
Liquidation is always lurking. If your trade drifts against you, there is an actual hard stop where the exchange will flatten you. That creates pressure to intervene emotionally.
Funding rates stack on top of losses. Holding a losing trade while paying funding feels like slow torture.
And finally, social influence makes it worse. Crypto Twitter and Discord are full of traders posting green PnL screenshots while you are sitting in a deep red slump.
So when your equity curve drops, the psychological weight is real.

Tracking drawdown is not optional. It helps you detach emotion from performance and measure the damage objectively. You need that clarity if you want to survive long term.
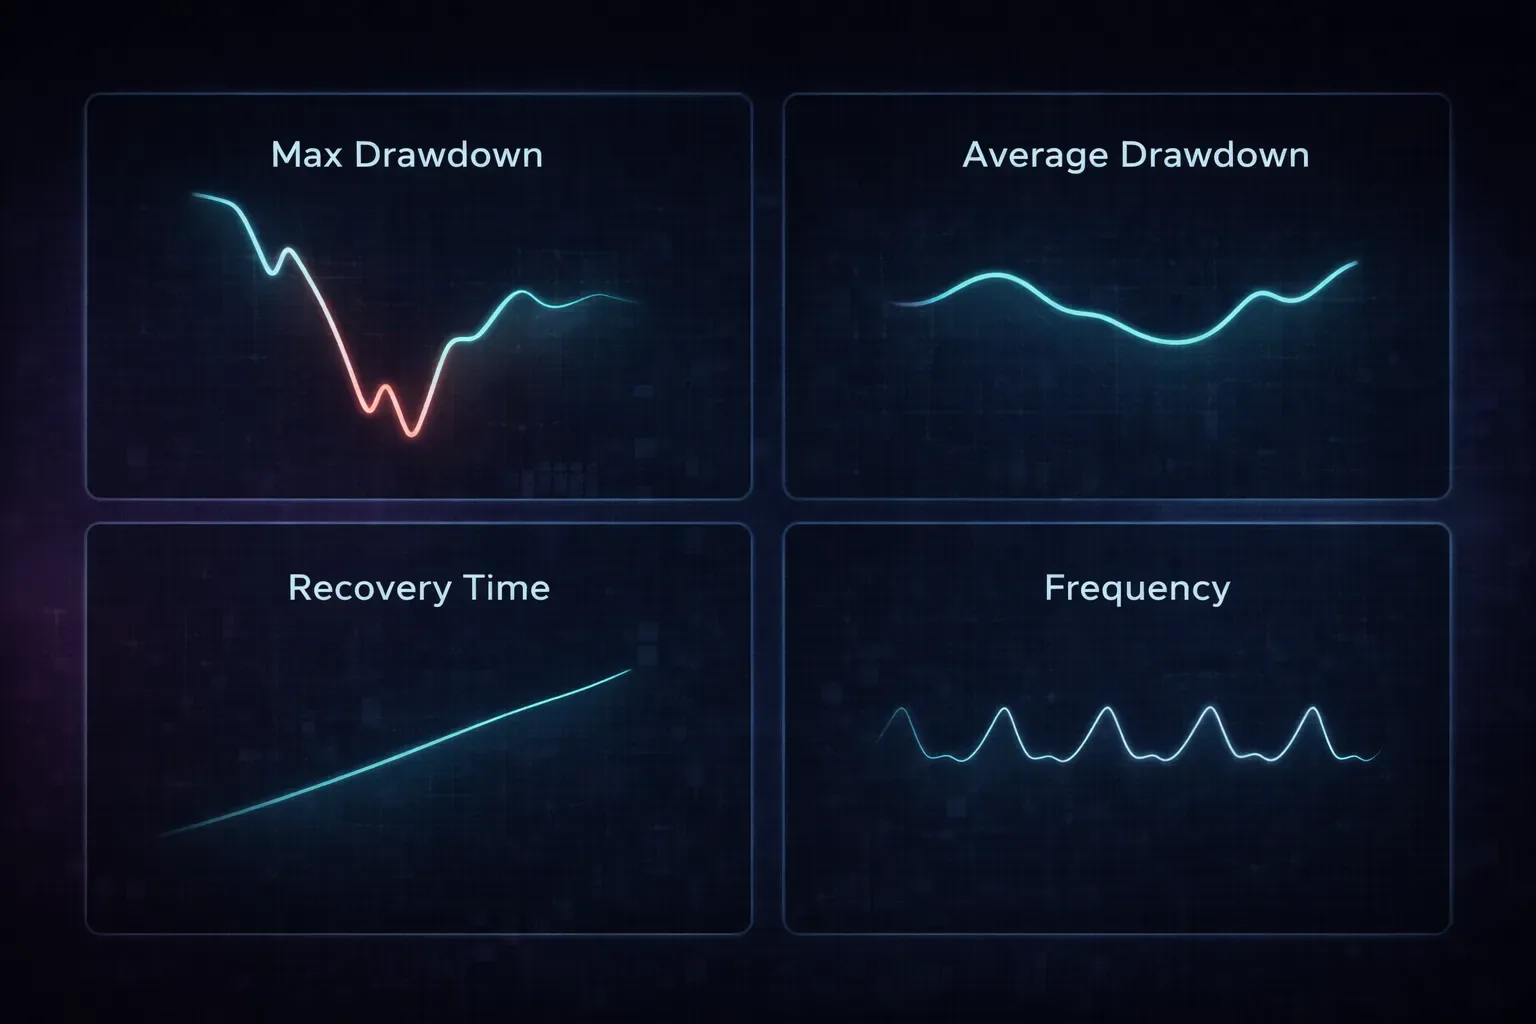
The Drawdown Stats That Actually Matter
Most traders overcomplicate risk. You really only need a few key drawdown statistics to understand your performance.
Here they are.
Maximum Drawdown
The worst equity decline from peak to trough. This is your pain threshold number.
Average Drawdown
How deep your typical losing cycle goes. This helps you spot when something is unusually wrong.
Recovery Time
How long it takes to climb back to the previous peak. Short recovery time suggests resilience. Long recovery means your strategy may be fragile or mis-sized.
Drawdown Frequency
How often you fall into meaningful drawdown. Frequent drawdowns may signal sloppy execution, overtrading, or inconsistent setups.
Here is what this might look like in a summary report:
Now some practical interpretation.
If your max drawdown is:
10–15%
You likely size conservatively or trade with strong discipline.
20–30%
This is common for active crypto day traders using leverage.
40%+
This is danger territory. Possible issues:
- oversizing
- tilt
- chasing moves
- lack of loss caps
- inconsistent strategy execution
None of these numbers are good or bad in isolation. What matters is whether your strategy and psychology can handle them.
A scalper taking 20 trades per day with small size might tolerate 20% drawdowns while still compounding consistently.
A higher time frame intraday trader risking 3–5% per trade should not be routinely hitting 40% account drawdowns.
Context matters. But honesty matters more.
A Real Example: The Drawdown Fix That Changed Everything
Let’s make this real.
A crypto scalper trades SOL and ETH perpetuals on OKX.
Average 10–15 trades per day.
Win rate around 58%.
Decent daily returns when things go well.
But every few weeks, the account equity curve collapses.
Drawdowns of 35–45%.
Then long slow climbs back to break even.
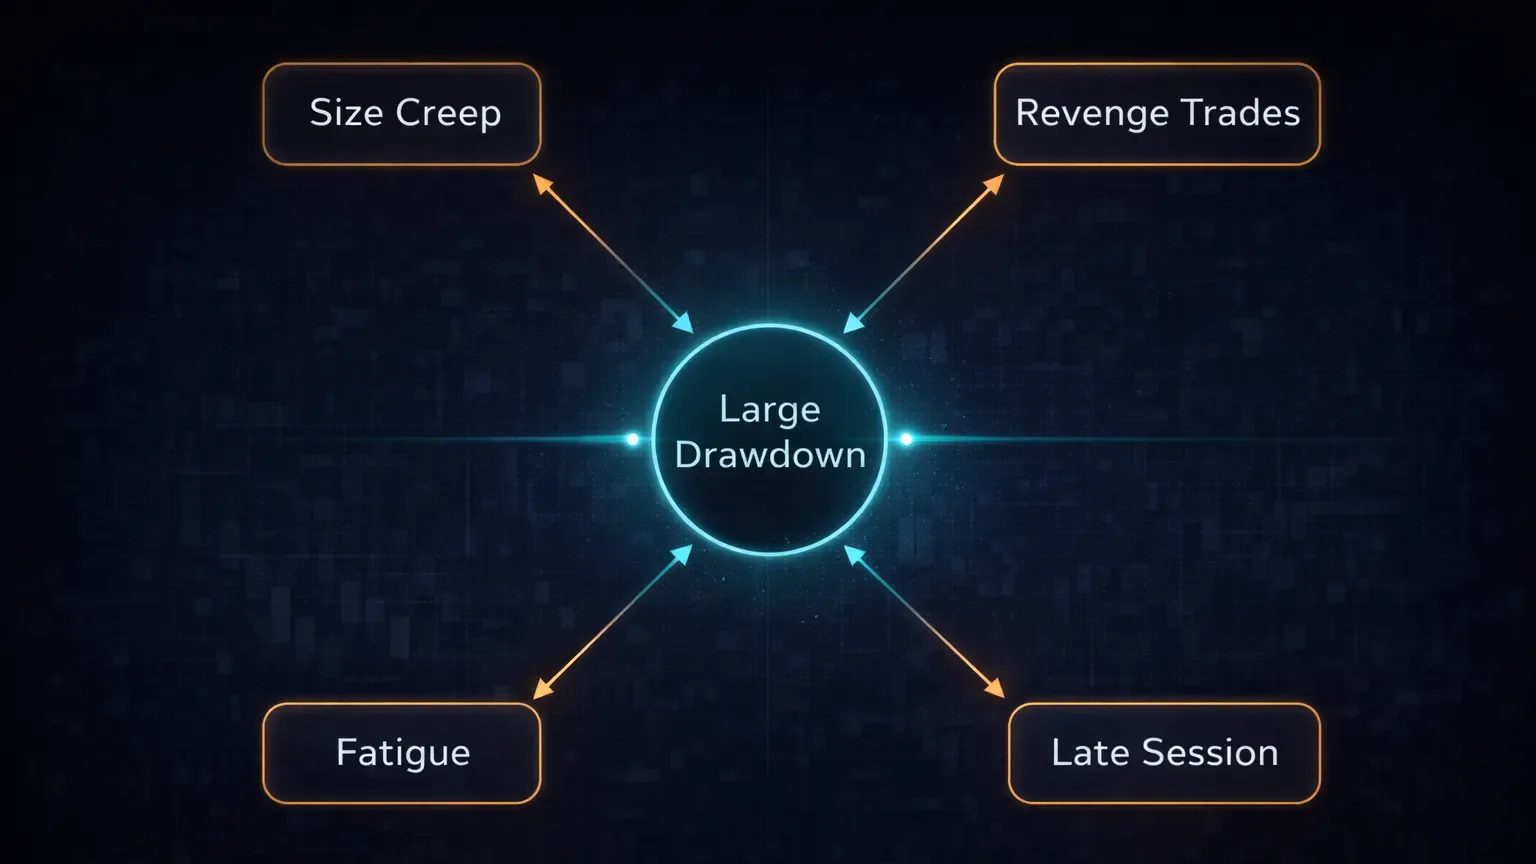
When they finally journal their trades properly, a few patterns stand out.
-
Position size increases after winning streaks
Confidence turns into aggression. Risk jumps without them realizing. -
Revenge trades appear after losses
They take lower quality setups just to “get it back”. -
Late session trading is worse
Fatigue. Emotional bias. Sloppy thinking.
Once these patterns are visible, adjustments become obvious.
They:
- Fix their risk per trade instead of sizing emotionally
- Add a daily loss cap
- Stop trading after two consecutive revenge-style entries
- Tag emotional trades and review weekly
Over the next month:
- Max drawdown shrinks from 42% to 18%
- Recovery time shortens dramatically
- Account equity stabilizes
They are not perfect. No trader is. But they remove the destructive tail risk that was killing their performance.
A crypto-first trading journal like TradeChainly makes this easier because tags, session stats, and drawdown history are visible and automated. That means you spend less time digging through spreadsheets and more time seeing what really matters.
The Trading Journal Angle: Tracking Drawdown Without Guessing
Knowing your drawdown is one thing. Tracking it consistently is where the edge develops.
In practice, it looks like this.
You import your trades automatically from exchanges like Binance, Bybit, Coinbase, or OKX. Your equity curve updates continuously as new trades settle. You can see exactly when your account makes a new high, and how far it pulls back during losing streaks.
Now layer on tags.
You might discover:
- Your biggest drawdowns happen when trading breakouts
- Or when you trade during high funding volatility
- Or when you continue trading after three losses
- Or only when you size above your plan
That is the turning point. Drawdown becomes a diagnostic signal rather than just a painful experience.
You can also connect drawdown to your daily journal notes. If a drawdown starts right when your mindset slips, that is important information.
A platform like TradeChainly helps crypto traders automate imports, visualize equity curves, review drawdowns, and connect them back to tags and notes. That makes consistent review much easier than trying to track everything manually.
Now visualize this review flow.
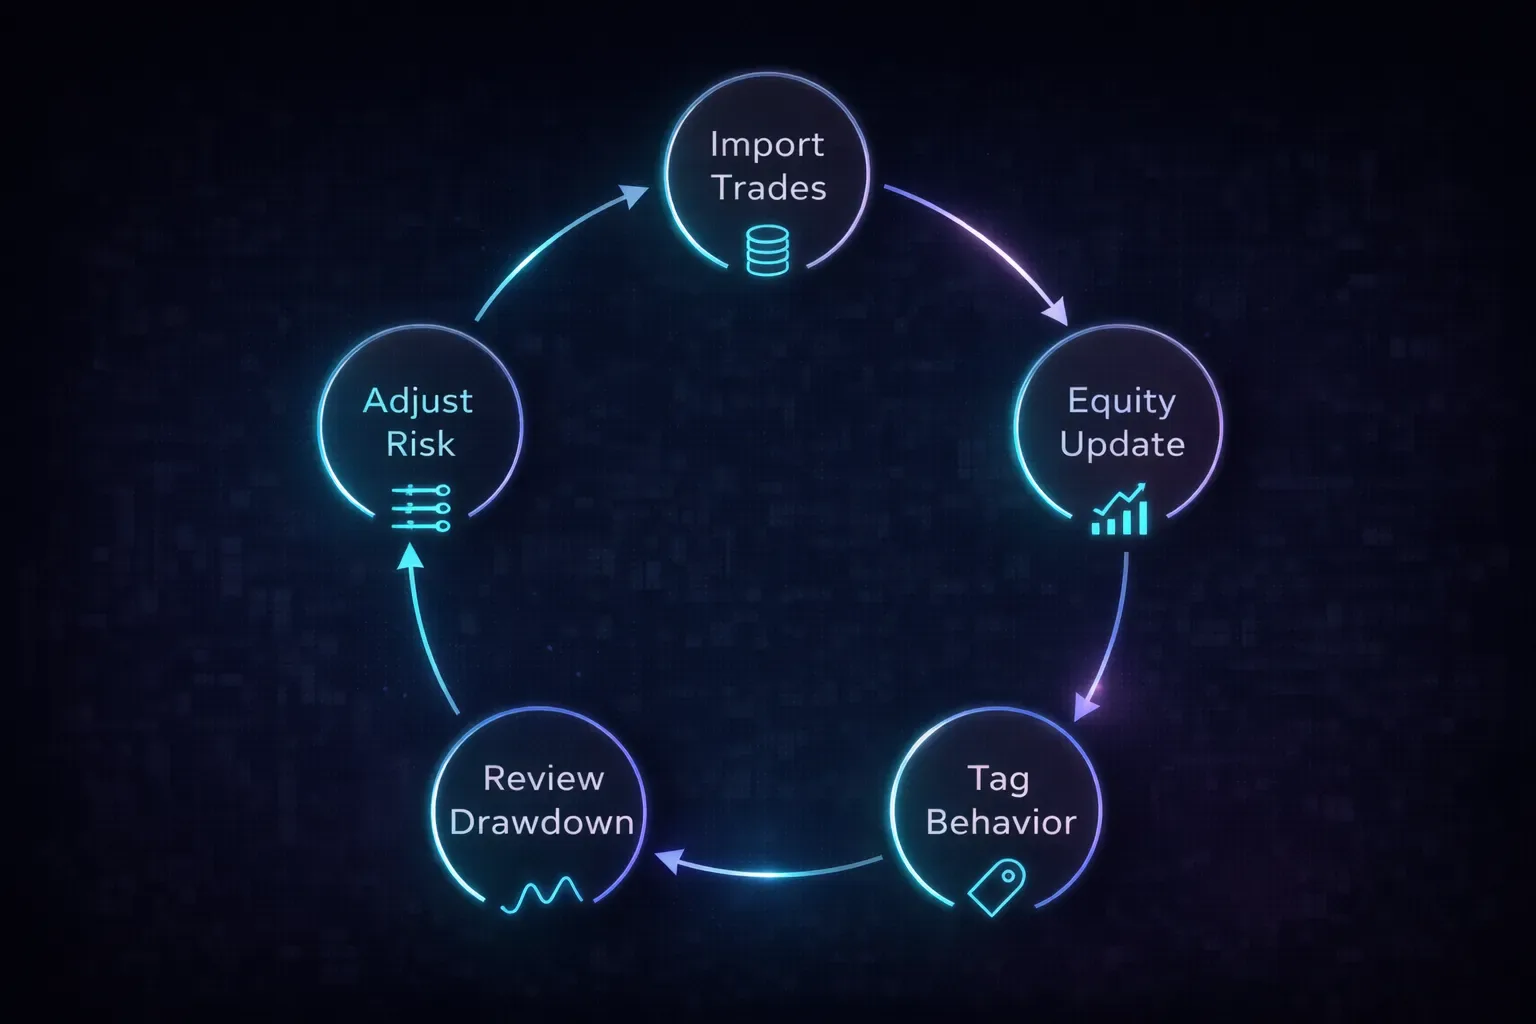
This is how you become data driven instead of reactive.
The Healthy Range Problem: What “Acceptable” Drawdown Looks Like
There is no universal number. But there are sensible ranges.
A “healthy” drawdown is one you can:
- recover from mathematically
- tolerate emotionally
- experience without changing your strategy in panic
For many crypto day traders:
10–25% max drawdown is workable
Over 30% begins to cause emotional instability
Over 40% often leads to account destruction
But again, context matters.
If you are trading with high leverage and aggressive risk, a 30% drawdown might appear fast. If you are trading small and grinding consistently, a 10% drawdown might feel enormous.
The real goal: Keep your worst periods survivable.
If your drawdown forces you to change your strategy in desperation, it is probably too large for your personality and capital base.
How to Reduce Drawdown Without Killing Your Edge
Reducing drawdown is not about trading scared. It is about removing the behaviors that create unnecessary damage.
A few proven approaches:
Set a daily loss cap
Once you hit it, you stop. Tilt happens when you continue.
Fix your risk per trade
Avoid size creep after winning streaks.
Tag mistakes
If revenge trades create half your drawdown, you now have a target.
Limit session exposure
Many traders perform worse at certain times of day.
Avoid trading during chaotic funding environments unless you have an edge
Funding can grind equity lower even when price is flat.
Do weekly reflection
Not motivational fluff. Real pattern analysis.
When you track these consistently in a journal, you start to notice cause and effect. Drawdowns stop being “bad luck” and start becoming signals.
Drawdown as a Performance Signal
Drawdown is not just a risk metric. It is a mirror.
It shows you:
- how you behave under pressure
- how resilient your strategy is
- whether your risk sizing makes sense
- when emotion overrides process
Crypto trading is volatile. Losses will happen. But deep, destructive drawdowns are often preventable once you begin measuring them and reviewing your data consistently.
A crypto-first trading journal like TradeChainly helps you see those patterns clearly so you can adjust earlier, stay stable longer, and build real consistency over time.
Control the downside. The upside will take care of itself.