When Profitable Setups Aren’t Actually Profitable
Win rate can look great on a setup and still leave you net negative after fees and funding. In crypto, that mismatch is common.
Ask most crypto day traders what their best setup is and you will get a confident answer. Breakout retest. Range deviation. VWAP reclaim. The conviction usually comes from a handful of memorable wins or a recent green streak. That confidence feels earned. The problem is that memory is a terrible performance analyst.
Crypto markets make this worse. Volatility compresses outcomes. One oversized winner during a liquidation cascade can erase weeks of mediocre execution in your mind. A clean trend day on BTC or ETH sticks emotionally far longer than ten chopped-up attempts that quietly bled fees and funding. When you rely on recall instead of data, your brain weights intensity over frequency and recent outcomes over long-term behavior.
This is how traders end up defending setups that are not actually profitable. They remember the screenshots, not the distribution. They remember the best entry, not the average entry. They remember the day price ran five R in their favor, not the cluster of small losses and scratches that came before it. In leveraged markets, those distortions compound quickly.
A different trap is mistaking activity for edge. A setup that triggers often feels productive. You are engaged, clicking, managing trades. But frequency alone does not equal profitability. Many high-frequency crypto setups look good in isolation and fail badly when you zoom out to net PnL after fees, funding, and slippage.
The pattern is clear: if you cannot point to setup-level data that shows expectancy over a meaningful sample, you do not actually know what your best setup is. You are guessing. Sometimes educated guessing, but guessing nonetheless.
Journal data matters for a simple reason. It removes self-deception. Your journal is the only place where every trade is treated equally, not just the ones your brain decided to remember.
If you want to identify real edges in crypto day trading, you have to replace conviction with evidence. The rest of this article is about how to do exactly that.

Profitable Setups Start With Definitions You Can Measure
Most traders talk about setups as ideas. “Breakout after consolidation.” “Mean reversion at range low.” “Trend pullback into VWAP.” These descriptions are useful for communication, but they are too fuzzy for analysis. Your journal does not understand narratives. It understands structure.
For setup analysis to work, a setup has to be something you can consistently tag and measure. That means it needs clear boundaries. If two trades feel similar in your head but would be tagged differently on a bad day, they are not the same setup. Most journal-based analysis breaks down here before it even starts.
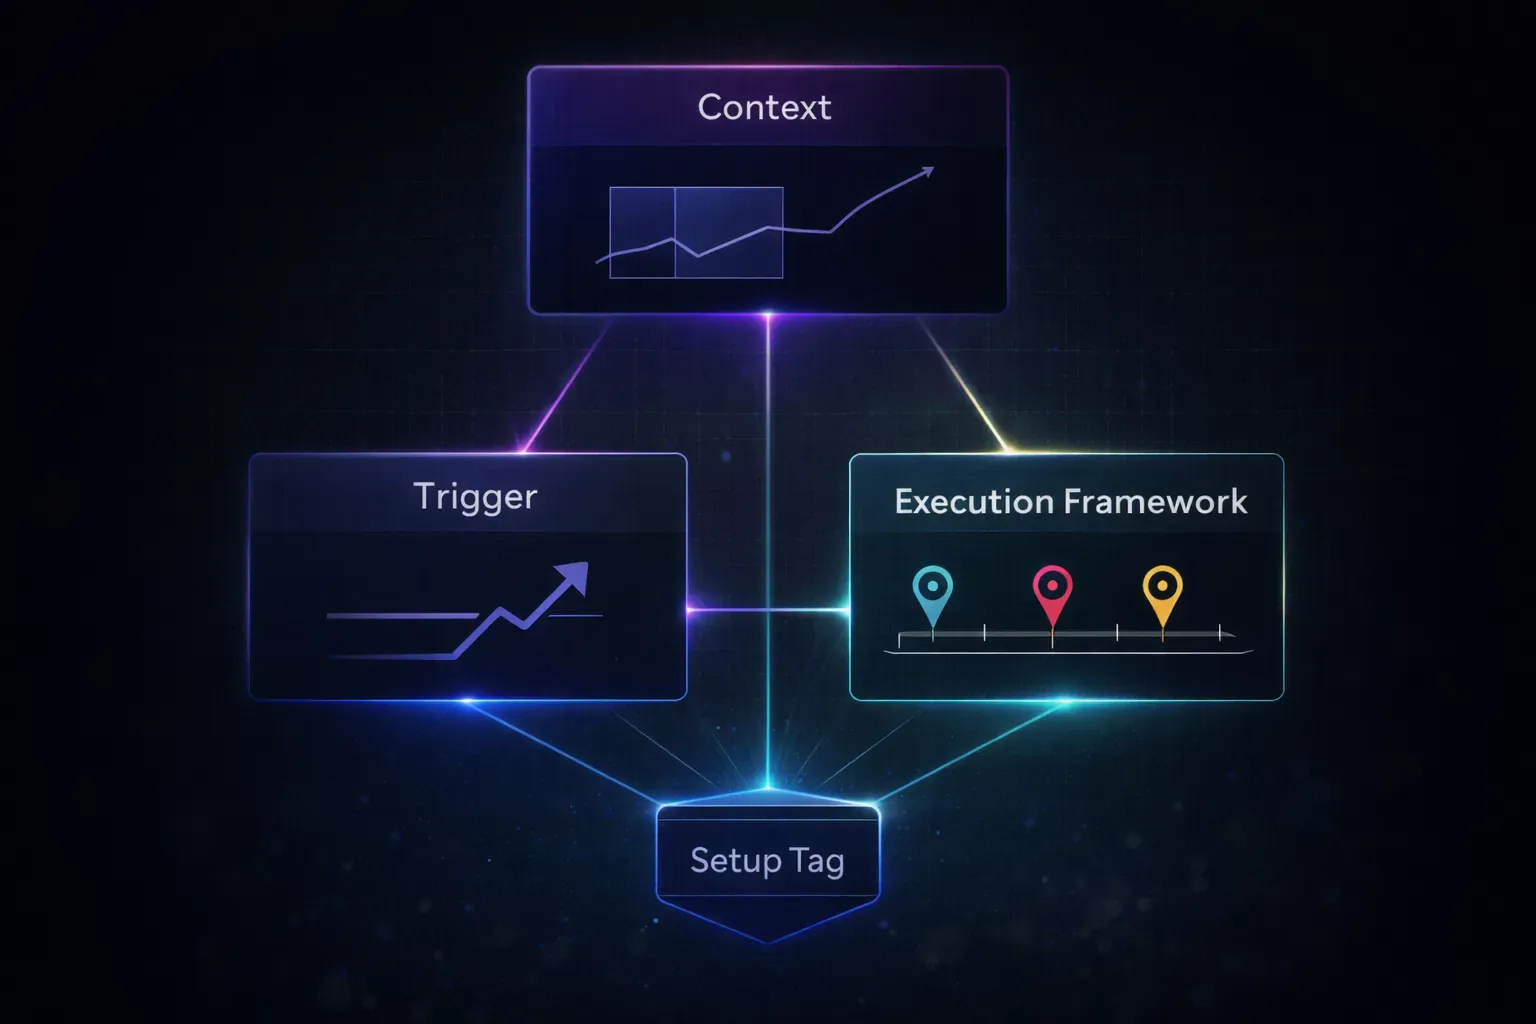
In journal terms, a setup is a repeatable combination of conditions that exists before you click buy or sell. It is not the outcome. It is not how confident you felt. It is not whether you followed rules perfectly. Those are separate dimensions. The setup is the market context and trigger that justified the trade in the first place.
For a crypto day trader, that usually includes three parts. First, the structural context. Trend, range, compression, or expansion. Second, the trigger. A reclaim, sweep, breakout, or failure. Third, the execution framework. Where entries, invalidation, and targets typically sit. You do not need to encode every detail, but you do need enough consistency that the tag means the same thing every time you use it.
Generic tags like “long” or “short” are useless for setup analysis. They describe direction, not logic. Even tags like “breakout” can be too broad if they lump together low-volume Asian session moves with high-liquidity New York opens. From a data perspective, those might as well be different strategies.
A clean setup tag is boring. It is narrow. It excludes trades that almost qualify. That is a feature, not a flaw. When you review your data later, you want each setup group to represent one specific behavior, not a grab bag of loosely related trades.
Once your setups are defined this way, the journal becomes a mirror instead of a diary. You are no longer asking, “Do I like this setup?” You are asking, “What does this setup actually do over time?” That shift is where real performance analysis begins.
Your Journal Structure Determines What You Can Learn
Once you are clear on what a setup actually is, the next question is whether your journal is structured in a way that lets you analyze it properly. Many traders record trades, but very few record them in a way that makes setup-level patterns obvious.
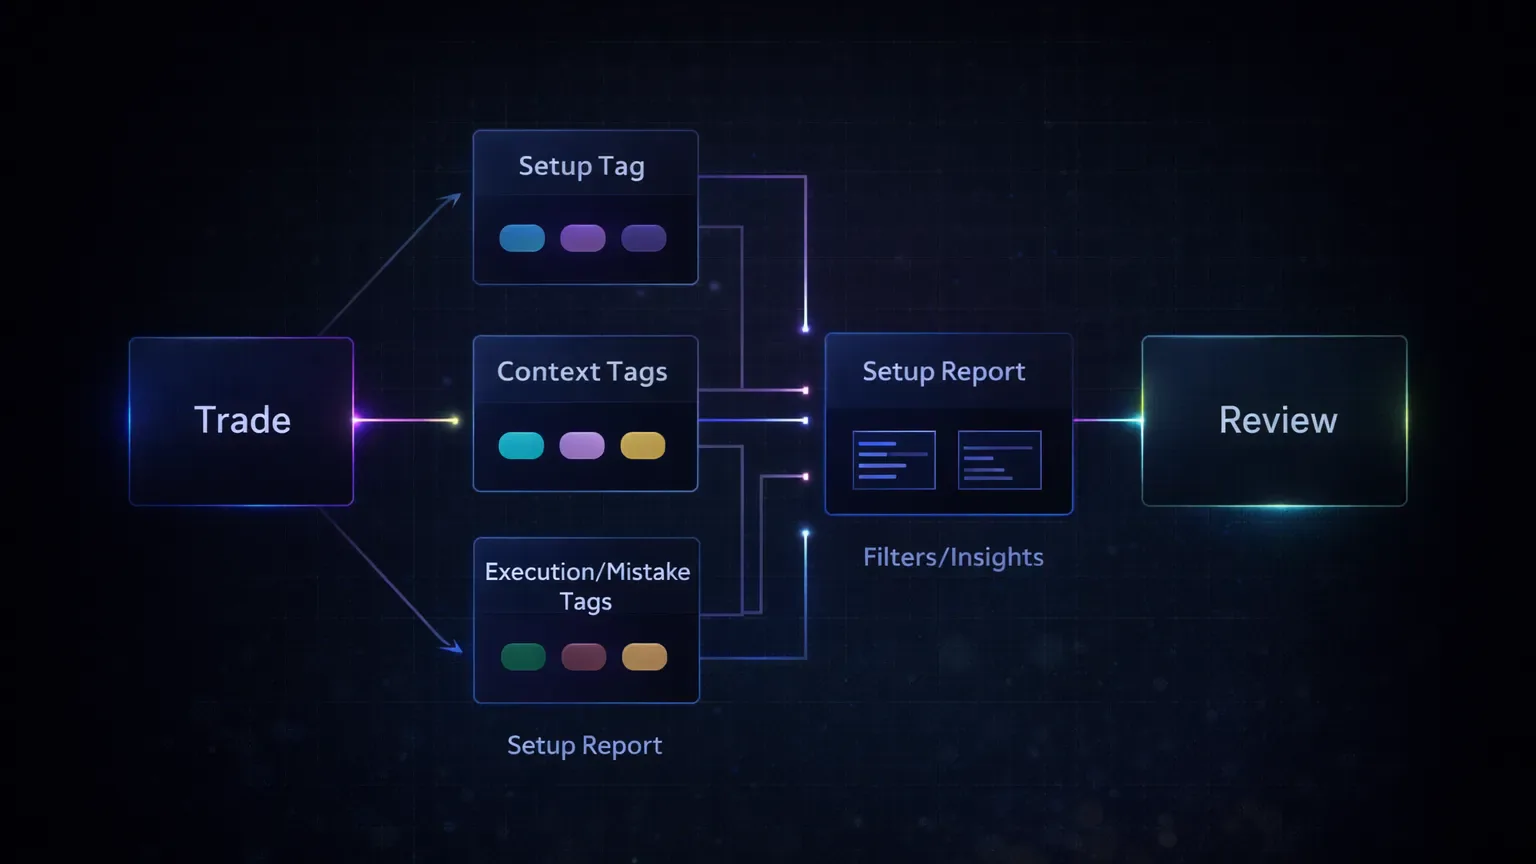
The foundation is consistent tagging. Every trade should have exactly one primary setup tag. Not two. Not a backup label “just in case.” One tag that represents the core idea behind the trade. If you feel tempted to apply multiple setup tags, that is usually a sign the setup definition is still too loose.
Setup tags should be separated from everything else. Mistakes, emotions, and execution errors deserve their own tags. If you mix them into setup labels, your data becomes polluted. A breakout that fails because of poor entry is still a breakout. The execution mistake explains the outcome, not the setup itself. Keeping those layers separate allows you to ask better questions later, like whether a setup is unprofitable by nature or only when you execute it poorly.
Market condition tags add another layer of clarity. Session, volatility regime, or day type can dramatically change how the same setup behaves in crypto. A range deviation during low-liquidity weekend trading is not the same trade as the same pattern during a New York session expansion. You do not need to over-tag, but a small number of context tags can reveal differences that would otherwise stay hidden.
Automation matters here more than most traders realize. Continuous trade sync removes selective memory from the dataset. Every scratch, every fee-heavy scalp, every stopped trade shows up. That completeness is what allows setup-level analysis to be honest instead of curated. This is one of the reasons traders gravitate toward platforms like TradeChainly once they stop wanting a diary and start wanting answers.
Finally, notes should support the data, not replace it. Short, factual notes about context or execution are far more useful than emotional journaling when your goal is setup analysis. Over time, the combination of clean setup tags, contextual tags, and complete trade history turns your journal into a dataset you can actually interrogate. That is when patterns start to surface without you having to force them.
The Metrics That Expose Real Setup Edge
Once your setups are clearly defined and consistently tagged, the real work begins. Many traders get lost because they look at the wrong numbers or interpret the right ones in the wrong way. Crypto trading punishes shallow analysis.
Win rate is the most common trap. A setup that wins 70 percent of the time feels safe, but safety is irrelevant if the losses are large and the wins are small. In leveraged markets, a single liquidation or oversized stop can erase dozens of small winners. That is why win rate on its own tells you almost nothing about setup quality.
Expectancy is the anchor metric. It answers one question: on average, how much does this setup make or lose per trade. A setup with a modest win rate but strong average winners can outperform a high win rate strategy that bleeds slowly through fees and occasional large losses. When you evaluate setups, expectancy should be the first number you look at and the last one you ignore.
Average profit and loss per trade adds texture to that picture. Two setups can have similar expectancy but very different distributions. One might produce steady, small gains. The other might rely on rare but large wins. Neither is inherently better, but they demand different execution discipline and emotional tolerance. Your journal data helps you see which profile actually fits how you trade in real conditions.
MAE and MFE are where setup behavior becomes tangible. Maximum adverse excursion shows how much heat a trade typically takes before working or failing. Maximum favorable excursion shows how much potential it usually offers. When a setup consistently reaches strong MFE but you exit early, the problem is likely execution. When MFE itself is limited, the setup may simply lack edge in current market conditions.
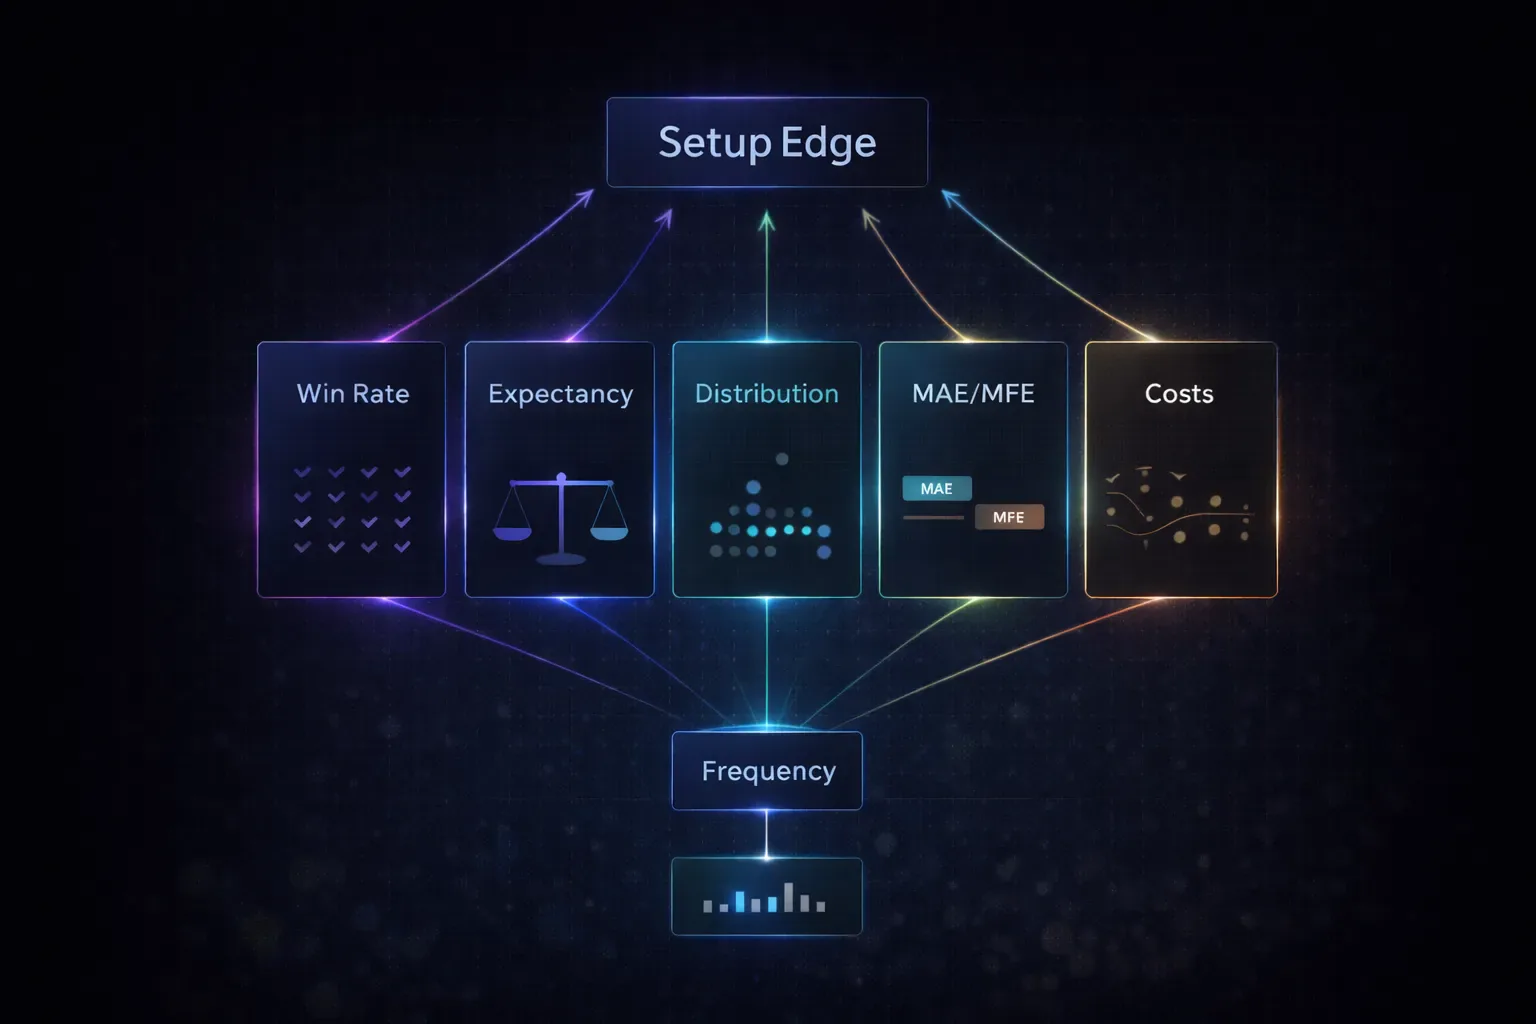
Trade frequency matters more than most traders admit. A setup that makes money but only appears twice a month may not move the needle, especially if it ties up attention and capital. Conversely, a slightly lower expectancy setup that triggers frequently can dominate your overall PnL. Journal data lets you see this trade-off clearly instead of guessing.
Finally, always interpret metrics in a crypto-specific context. Fees, funding rates, and slippage are not rounding errors in active trading. They are structural costs. A setup that looks profitable before costs can quietly turn negative once those frictions are included. When your journal includes net results, not just theoretical R multiples, you stop lying to yourself about what actually works.
A Real Example of a "Favorite Setup" That Barely Worked
For example, consider a Binance futures trader who mainly scalps BTC and ETH perpetuals during the London and New York sessions. If you asked him what his best setup was, he would not hesitate. A breakout after tight consolidation, entered on the first pullback. He had screenshots of clean wins and could recall several days where that pattern paid for the session in one trade.
When he grouped his trades by setup in his journal, the picture changed. The breakout pullback setup did have strong winners, but it also had a high failure rate outside of specific conditions. On days with low volatility or choppy range behavior, the same pattern produced a string of small losses and scratches. Because the winners were memorable, he had mentally discounted those losses.
The data made that discounting impossible. Over a sample of about 80 trades, the setup’s win rate sat just under 45 percent. Expectancy was barely positive. More interestingly, MAE was consistently high. The trades often went deep against him before either working or stopping out. That explained why execution felt stressful even on days that ended green.

When he filtered the same setup by session and volatility, a clearer edge emerged. During New York open expansions, the breakout pullback had significantly better expectancy and lower average MAE. Outside of that window, it was a net loser after fees and funding. The setup itself was not bad. The conditions under which it was traded were.
The adjustment was simple but uncomfortable. He stopped trading the setup during low-volatility environments and limited it to specific session windows. He also tightened invalidation levels based on the MAE data instead of gut feel. Over the next 40 trades, expectancy improved meaningfully and drawdowns became shallower.
Nothing about his strategy changed on paper. What changed was that the setup was no longer defined by memory or preference. It was defined by behavior in the data. That shift is what turns a “favorite setup” into an actual edge you can trust.
Hidden Losers Show Up As “Fine” Trades
Some of the most damaging setups in a trader’s journal are not obvious losers. They look productive. They generate green trades. They even contribute positively to confidence. The damage shows up quietly in the long-term curve.
A common example in crypto is the high win rate scalp. These setups often target small moves with tight stops and frequent entries. On the surface, they look excellent. Many wins, few large losses. The problem is that fees and funding do not care about your win rate. When you trade frequently for small targets, costs compound fast. Journal data often reveals that these setups are net negative despite a strong-looking strike rate.
Another masquerader is the “almost breakout” trade. These occur when price approaches a key level, offers a partial signal, and then stalls. Traders convince themselves they are being early. In the journal, these trades often cluster around small losses and scratches. Individually they seem harmless. Collectively they drain attention and capital without delivering meaningful upside.
Weekend trading introduces its own traps. Liquidity is thinner. Moves are more erratic. A setup that performs well during high-liquidity weekday sessions can behave very differently on Saturday or Sunday. Without tagging by day or session, these losses blend into the dataset and mask the real issue. The setup is not broken. The environment is.

Overtrading is the final disguise. Some setups are not inherently bad, but they are executed far too often. The journal shows this through frequency and declining expectancy over time. What initially worked becomes diluted as you take marginal versions of the same idea. This is especially common in 24/7 markets where there is always something moving.
The value of journal analysis is not just in finding what works. It is in exposing what quietly does not. When you can see which setups lose money slowly and consistently, you gain the option to eliminate them. That alone can improve performance more than discovering a new strategy.
A Repeatable Review Process Protects Your Edge
Identifying profitable setups once is useful. Building a process that keeps them profitable is what actually changes your results. Crypto markets evolve. Volatility regimes shift. What worked cleanly two months ago can degrade without warning. Your review workflow is what catches that before the damage compounds.
A simple cadence works best. Most active day traders benefit from a weekly setup review and a deeper monthly check. The weekly review answers one question: did any setup behave unusually over the last batch of trades. You are not optimizing here. You are looking for early signs of drift, increased MAE, or a sudden drop in expectancy.

The monthly review is where decisions happen. This is where you evaluate setups over a meaningful sample and decide whether to continue, restrict, adjust, or pause them. Journals that surface setup-level reports make this much easier because you are comparing like with like instead of scrolling through individual trades. Platforms like TradeChainly are built around this kind of structured review, where setups, tags, and metrics live in the same place.
When a setup underperforms, resist the urge to immediately “fix” it. First, isolate why. Is the issue execution, shown by poor exits or oversized MAE relative to historical norms? Is it contextual, such as session or volatility changes? Or is the edge itself gone? Your data usually points to one of these answers if you let it.
If execution is the problem, tighten rules and reduce size while you recalibrate. If context is the issue, restrict the setup to the environments where it has historically performed. If the edge is gone, pause it completely. Pausing is not failure. It is capital preservation.
Consistency is the point. The same way you define setups consistently, you review them consistently. Over time, this turns your journal into a feedback loop instead of a record. You stop reacting emotionally to individual days and start making changes based on patterns. That is how data-driven traders stay aligned with markets that never sleep.
What Changes When You Let Data Pick the Setup
Most traders do not fail because they lack ideas. They fail because they trust ideas more than evidence. In crypto, that gap gets punished faster due to leverage, fees, and nonstop opportunity. Conviction feels strong in the moment. Data is quieter, slower, and far more reliable.
Journal-driven setup analysis changes how you relate to outcomes. You stop arguing with them. You stop defending trades because they felt right. Instead, you start asking better questions. Under which conditions does this setup actually work? How much heat does it usually take? What does it contribute over a meaningful sample, not a good day.
This approach does not make trading easier in the emotional sense. It removes comforting narratives. But it does make improvement simpler. You know what to keep, what to restrict, and what to cut. Over time, your trading becomes less about finding the next great setup and more about refining the few that consistently prove themselves.

A crypto trading journal that supports clean tagging, setup-level metrics, and regular review makes this process sustainable. That is the difference between journaling as reflection and journaling as decision-making. When your setups are decided by data instead of memory, you trade with clarity instead of hope.