
Timeframe Performance Hides Your Biggest Leaks
Your “best timeframe” is often the one that hides your biggest leak.
Most crypto traders think they know their “best timeframe.” Ask around and you’ll hear answers like 1-minute scalps, 5-minute entries, or 15-minute structure trades. What traders usually mean is the chart they like to click buttons on. That’s not the same thing as understanding how time actually affects their results.
Performance by timeframe is misunderstood because traders review their data in aggregates. Win rate, average R, total PnL. Those numbers feel clean and objective, but they flatten everything. They don’t tell you whether your edge works for five minutes and then decays. They don’t show whether your losses come from bad entries or from staying in trades too long after the original thesis stops being valid.
Crypto makes this problem worse. Markets run 24/7. Volatility shifts fast. Funding rates flip. Liquidity changes between sessions. You can take the same setup ten times and get ten different outcomes depending on when you trade it and how long you hold it. When all of that gets blended into one performance snapshot, the signal disappears.
Another source of confusion is mixing chart timeframe with trade duration. A trader might execute on the 1-minute chart but end up holding for 45 minutes because price chops or funding turns against them. On paper, they still call it a “scalp.” In the data, it behaves like a weak intraday hold. That mismatch quietly eats expectancy.
Timeframe-based performance is not about finding the perfect chart setting. It’s about understanding when your decision-making stays sharp and when it starts to break down. Until you separate your results by time, you’re guessing where your real edge lives.

Timeframe Performance Means Three Different Things in Crypto
When traders talk about timeframe performance, the conversation usually stops at chart intervals. One-minute versus five-minute. Scalping versus intraday. That framing is too shallow for crypto, where time interacts with volatility, funding, and liquidity in ways that don’t exist in traditional markets.
Performance by timeframe means measuring how your results change as time passes after entry. It is less about the candle you enter on and more about how long your edge survives once you are in the trade. A clean entry can still turn into a bad trade if it drags on through chop, funding flips, or a sudden liquidity vacuum.
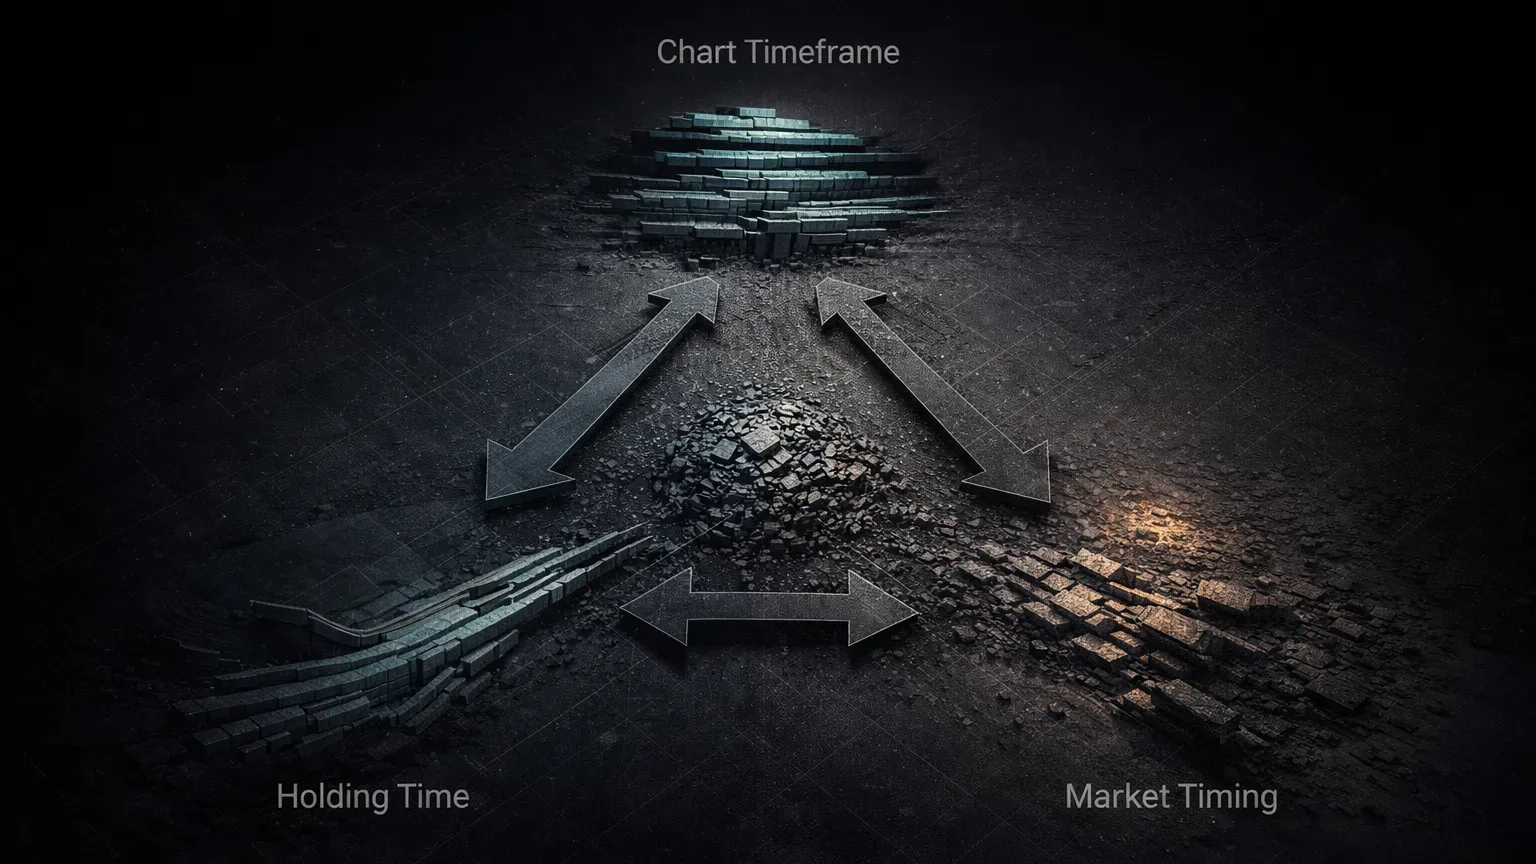
There are three different “timeframes” at play in crypto trading, and confusing them leads to bad conclusions.
The first is chart timeframe. This is the visual resolution you use to spot entries and exits. It affects how clean setups look, but it does not dictate how long you actually stay in trades.
Holding time is the second. This is the real clock. Seconds, minutes, or hours from entry to exit. Holding time is where most performance leaks hide. Many traders discover that their winners are clustered in a narrow time window, while losers expand in duration as they hesitate, hope, or wait for confirmation that never comes.
The third is market timing. Crypto trades behave differently depending on session, volatility regime, and funding context. A five-minute hold during the New York open is not the same trade as a five-minute hold during a low-liquidity weekend range. The clock might show the same duration, but the conditions are completely different.
Because crypto is continuous and highly leveraged, time compounds risk faster than most traders realize. Liquidation cascades can unfold in seconds. Funding payments can quietly drain edge from slow trades. Volatility can expand and contract within a single hour. If you do not analyze performance through a time-aware lens, you end up optimizing the wrong things.
Tracking performance by timeframe is about aligning your execution with the periods where your read, reactions, and risk control actually work. Everything outside that window needs tighter rules or less exposure.
Turn Time Into a Performance Variable
When you break timeframe performance down properly, patterns start to show up fast. Not abstract patterns, but very practical ones that explain why certain trades feel effortless while others spiral out of control. For most crypto day traders and scalpers, three dimensions matter far more than chart settings.
Holding Time Buckets Reveal Where Edge Decays
Holding time is the most direct and often the most uncomfortable metric to review. It forces you to confront how long you actually stay in trades, not how long you planned to.
When you bucket trades by duration, clear clusters tend to appear. Very short holds often show high efficiency. Clean entries, fast reactions, and decisive exits. Then there is usually a middle zone where performance flattens. After that, expectancy often turns negative as hesitation creeps in and initial conviction fades.
In crypto, this decay happens faster than many traders expect. Volatility compresses and expands quickly. A trade that does not move in your favor within a defined window is often telling you something. Holding through that signal usually means absorbing noise, funding costs, and psychological drift.
Metrics like MAE and MFE become useful here. If your maximum favorable excursion peaks early but your exit happens much later, you are not dealing with a strategy issue. You are dealing with a time management issue. The edge was there. You just overstayed it.
Session-Based Performance Shows Where You Actually Execute Well
Crypto trades around the clock, but performance does not distribute evenly across time zones. Liquidity, participation, and behavior shift between sessions, and your results reflect that whether you track it or not.
Many traders discover that their best performance clusters around specific windows. The London open. The New York overlap. High-volume continuation moves after major economic releases. Outside of those windows, win rate may stay similar, but trade quality drops. Slippage increases. Follow-through weakens.
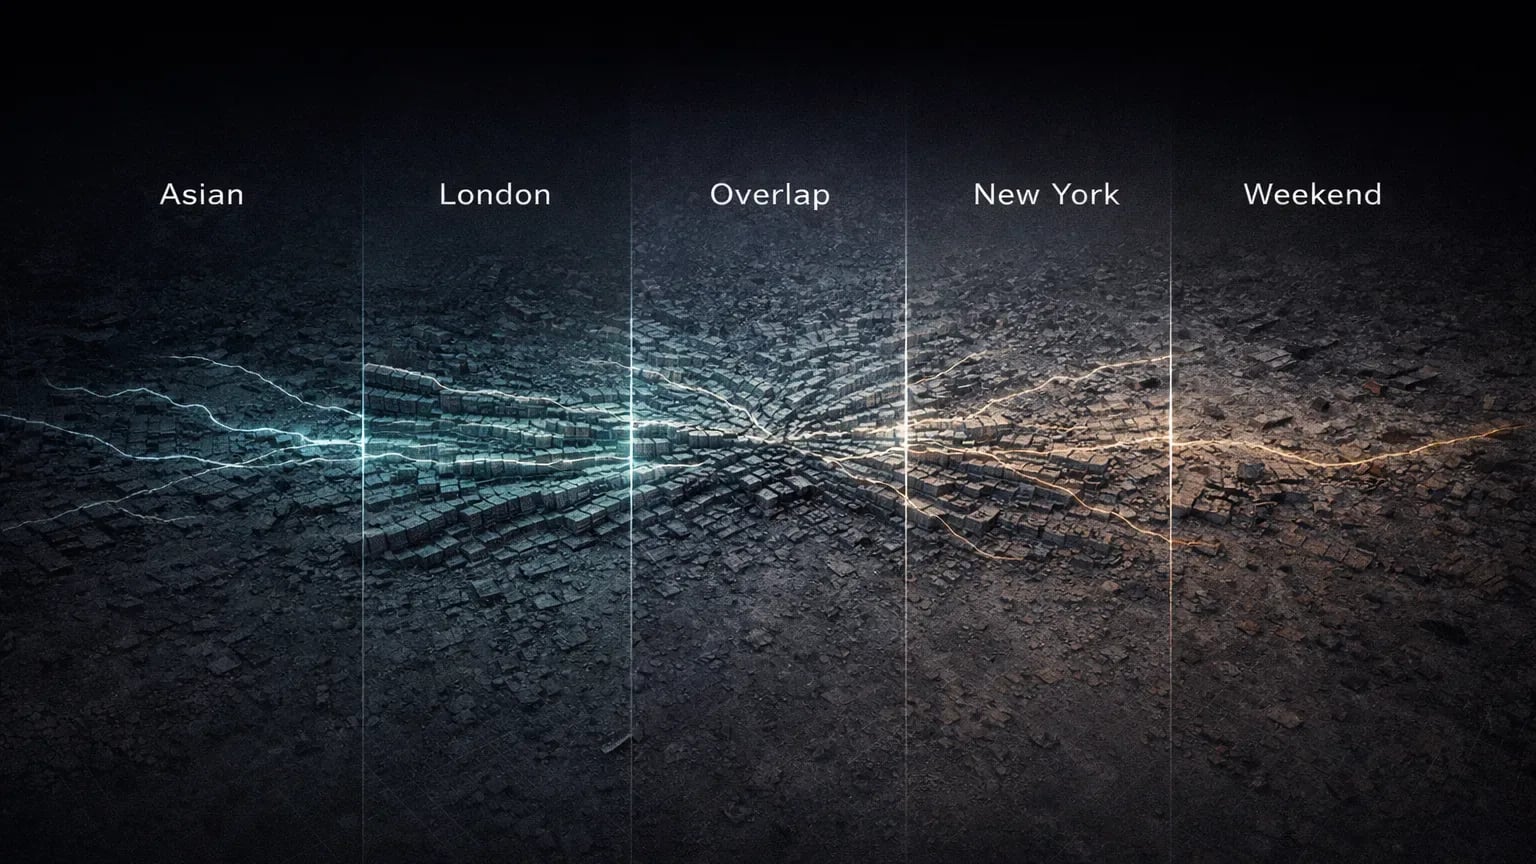
Session analysis also exposes weekend behavior. Lower liquidity and thinner order books can make stops less reliable and targets harder to reach. What looks like patience can turn into slow bleed when funding and chop combine.
Exchange choice matters here too. Binance might show tighter spreads and cleaner reactions during peak hours, while another venue behaves erratically in off-hours. Without session-based review, these differences get lumped together and dismissed as randomness.
Volatility Regime Timing Explains Why the Same Setup "Stops Working"
Time does not exist in isolation from volatility. The same five-minute hold can behave very differently depending on whether the market is expanding or compressing.
In expansion phases, trades either work quickly or fail fast. In compression, time stretches. Moves stall. Fake breakouts increase. If your data shows strong performance in high-volatility windows and weak performance during low-volatility periods, the solution is not better entries. It is selective timing.
By tagging trades by volatility context and comparing holding times, you can see where patience is rewarded and where it is punished. This is especially relevant in crypto, where sudden regime shifts can happen without warning.
Understanding these three dimensions together turns timeframe from a vague preference into a measurable performance variable.
How a Scalper Fixed Edge by Cutting Time
A common pattern in crypto journals is a trader who looks profitable on paper but feels constantly frustrated in execution. The stats are not terrible. Win rate is acceptable. The strategy “works.” Yet the equity curve goes sideways for weeks.
In this case, the trader was scalping SOL perpetuals on Binance, primarily on the 1-minute and 3-minute charts. Entries were clean. Most trades went positive shortly after entry. The problem showed up after that.
When trades were grouped by holding time, a clear split appeared. Positions closed within the first five minutes had strong expectancy. After that window, performance dropped sharply. Trades held longer than fifteen minutes were net negative, even though many of them had been in profit earlier.
Digging deeper revealed the real issue. The trader was treating every trade as a scalp, but managing losers like intraday holds. When price stalled or funding flipped, instead of exiting, he waited. Sometimes he added. Often he rationalized. The longer the trade stayed open, the worse the decision-making became.
The adjustment was simple but uncomfortable. A hard maximum holding time was introduced for scalps. If the trade did not progress within a defined window, it was closed regardless of unrealized PnL. No exceptions. No narrative.

Session filters were added next. Most losing extended holds came from low-liquidity periods outside the New York and London overlap. Those hours were cut entirely for scalping.
The result was not a higher win rate. It was cleaner losses and faster exits. Expectancy improved because profits were realized where the edge actually existed. Nothing about the setup changed. Only the relationship with time did.
Build Timeframe Analysis Into Your Journal Reviews
Time is a performance variable. The next step is building a review process that makes it visible. This is where most traders fall short. They know something feels off with how long they hold trades, but they never turn that feeling into data they can act on.
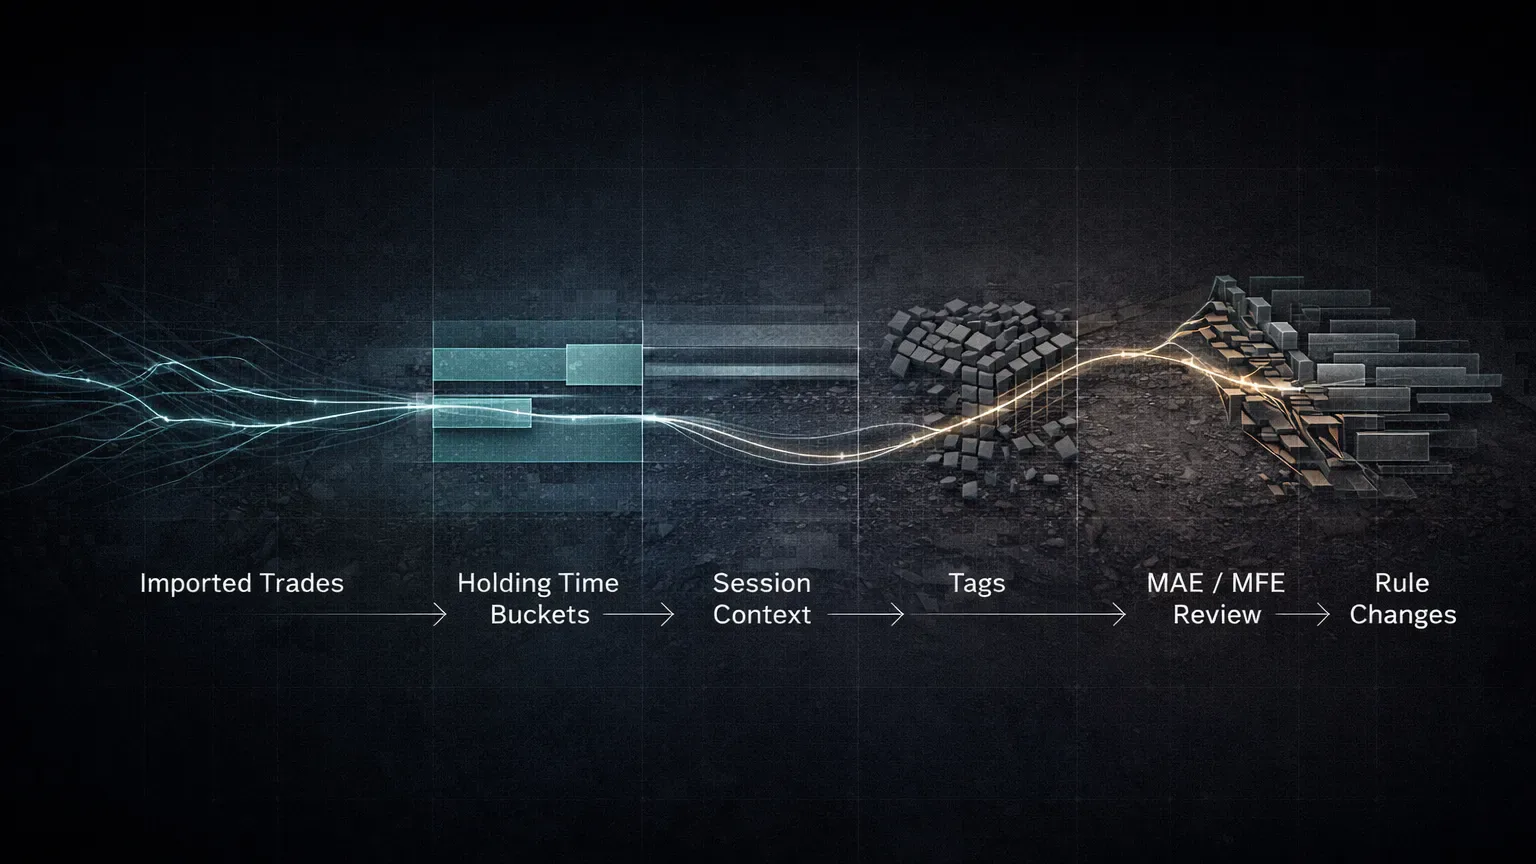
Start by segmenting trades by holding time. Not vague labels like “quick” or “long,” but actual duration buckets that reflect how you trade. For a scalper, that might be 0–2 minutes, 2–5 minutes, 5–15 minutes, and anything beyond that. For each bucket, look at expectancy, average R, MAE, and MFE. The goal is not to judge individual trades but to see where performance bends.
Next, layer context on top of time. Holding time alone tells part of the story. Combine it with session data and tags. A five-minute hold during a high-volume New York open is a very different trade from a five-minute hold during a Sunday range. When you filter by both time and session, patterns sharpen quickly.
Tags are especially powerful here. Tagging trades by setup, mistake, or emotional state lets you see whether certain behaviors only show up after a trade has been open too long. Many traders discover that over-management, revenge adds, or late exits cluster in extended-duration trades. That insight is hard to ignore once it is visible.
Metrics like MAE and MFE help answer a critical question: did the market give you what you wanted early, and did you fail to take it? If maximum favorable excursion peaks early and then retraces while you stay in the trade, the issue is rarely strategy. It is hesitation and hope creeping in as time passes.
A journal that supports time-based filtering makes this process much faster. When trades are continuously imported and duration is tracked automatically, you can move from intuition to evidence. Platforms like TradeChainly make it possible to slice performance by holding time, session, and tag without exporting spreadsheets or doing manual math. The value is not in the tool itself, but in how quickly you can turn review into clear rules.
Timeframe Traps That Quietly Kill Expectancy
Once traders start reviewing performance by timeframe, the same mistakes show up again and again. They are not obvious in individual trades, but they become painfully clear in aggregated data.
The biggest trap is overstaying winners during funding shifts. A trade that works quickly can turn into a slow bleed when funding flips against you. Instead of exiting with a clean gain, traders justify staying in because price has not invalidated the setup. Over time, funding and chop quietly erase the edge.
Another trap is forcing trades outside your best session. Many traders have strong performance during specific windows but keep trading through low-quality hours out of boredom or fear of missing moves. The result is more time in the market, not better trades. When you compare holding time and session data, these hours often produce longer holds with worse outcomes.
There is also the problem of mixing trade styles without realizing it. A scalp that turns into an intraday hold is rarely a deliberate decision. It is usually hesitation disguised as flexibility. In the data, these hybrid trades tend to have the worst expectancy because they violate the rules of both approaches.
There is also the belief that patience fixes bad timing. In crypto, patience often increases exposure to randomness. Volatility regimes change quickly. Liquidity can vanish. Liquidation cascades can reverse structure in minutes. Holding longer does not automatically improve odds. In many cases, it does the opposite.
Timeframe analysis exposes these traps without judgment. It shows you where time is helping you and where it is actively working against you.

Turn Insights Into Time-Aware Rules
Timeframe analysis only matters if it changes how you trade. The goal is not to collect more stats, but to convert what you see in the data into rules that reduce decision fatigue and prevent known mistakes.
The first place to apply this is exits. If your data shows that expectancy drops sharply after a certain holding time, that is a rule waiting to be written. A maximum time-in-trade forces decisiveness. It removes the gray area where hope and second-guessing take over. You are no longer asking whether the trade might work. You are acting on evidence that it probably will not.
Session-based rules come next. If your best trades cluster around specific windows, treat those windows as part of your edge. That might mean trading smaller size outside of them or not trading at all. Many traders see immediate improvement simply by cutting low-quality hours, even though total trade count drops.
Volatility-aware rules help refine patience. Instead of holding because you “should,” you hold only when the environment supports it. In expansion phases, you give trades room to work quickly. In compression, you tighten expectations or step aside. Timeframe data makes this distinction concrete instead of emotional.
Simplicity matters. Time-aware rules should reduce thinking, not add more variables. A few well-defined constraints around holding time and session can do more for consistency than endless tweaks to entries. When your rules reflect how you actually perform, execution becomes calmer and more repeatable.
Trade the Time Window Where You Win
Most traders spend years refining entries while ignoring the simplest question their data is trying to answer: how long does my edge really last? Timeframe-based performance analysis brings that answer into focus.
When you review results through the lens of holding time, session, and volatility, a clearer picture emerges. You stop guessing where you trade best. You see it. You learn which trades deserve patience and which ones need faster decisions. You also uncover where discipline slips in, not because of bad strategy, but because time drags you into worse choices.

This is especially important in crypto, where the market never closes and conditions shift fast. Time can either work for you or quietly erode your edge. The difference is whether you track it and build rules around it.
A good trading journal makes this process repeatable. When trades are automatically logged and performance can be filtered by duration, session, and context, reviewing time-based patterns becomes part of your normal workflow instead of a once-a-month audit. Tools like TradeChainly are designed for that kind of ongoing review, so insights don’t get lost between trades.
You do not need a new strategy to improve. You need to trade inside the time window where your decisions are sharp and your edge shows up consistently.
The cost of ignoring this is simple: you keep donating your best trades back to the market after your edge has already faded.