Why R-Multiple Matters for Crypto Risk Management
Crypto trading is fast, chaotic, emotional, and often unpredictable. The market never sleeps. Price can spike ten percent in minutes on Binance futures, then dump straight back down on Bybit while funding flips. If you are day trading or scalping, every entry decision carries real risk. The problem is that most traders only look at profit and loss in dollars or percentages. That number tells you how much you made or lost, but it does not tell you whether you traded well.
This is where R-multiple becomes incredibly useful. R-multiple is a way to measure every trade based on the amount of risk you took. Instead of thinking in dollar profit, you measure your result compared to your stop loss distance. If you risked $100 and made $300, that is a +3R trade. If you risked $100 and lost $100, that is a -1R trade. Now every trade becomes comparable, even if the position size or market changes.
TradeChainly helps you calculate and track R-multiple automatically, so you always know how much risk you took and whether your trades are paying off. This matters more in crypto than almost any other market. Leverage magnifies emotions. Volatility punishes hesitation. If you do not understand your risk profile, your results will feel random.
In this guide, you will learn what R-multiple is, why it matters for crypto day traders, and how TradeChainly helps you apply it consistently. The goal is simple. Once you start thinking in R instead of dollars, you stop guessing. You begin to treat trading like a repeatable process instead of gambling. That mindset shift is often where consistency finally starts.
What Is R-Multiple and Why It Matters in Crypto Trading?
R-multiple is simply a way of measuring the outcome of a trade relative to the risk you took. The “R” represents your initial risk. That is the distance between your entry price and your stop loss. If that distance equals $100 of risk, then 1R equals $100 for that trade. From there, everything becomes easy to measure. A -1R trade means you were stopped out. A +2R trade means you made twice what you risked. A +0.5R trade means you took partial profits before your full target was hit.
The power of R-multiple is that it normalizes your results. Crypto traders often increase or decrease position size based on confidence, volatility, or pure emotion. When you only look at profit in dollars, you cannot compare trades properly. A $500 win might look great, but if you risked $400 to achieve it, that is only about +1.25R. Meanwhile, a $150 win on a smaller trade might actually be +3R. Without R-multiple, those two trades look completely different. With R-multiple, the second trade was actually the better one.
This matters even more in crypto because volatility is always changing. Bitcoin might move slowly one day, then an altcoin like SOL or DOGE might explode the next. If your stop size is wider on volatile assets, your R should still mean the same thing. That consistency makes it easier to understand whether your strategy is profitable or not.
Another benefit is emotional clarity. When you think in R instead of dollars, you detach from account balance swings. You stop thinking “I need to make $1,000 today.” Instead, you think “I want to execute for +2R to +4R total today.” That shift is huge. It allows you to size your trades logically, instead of sizing based on random profit goals.
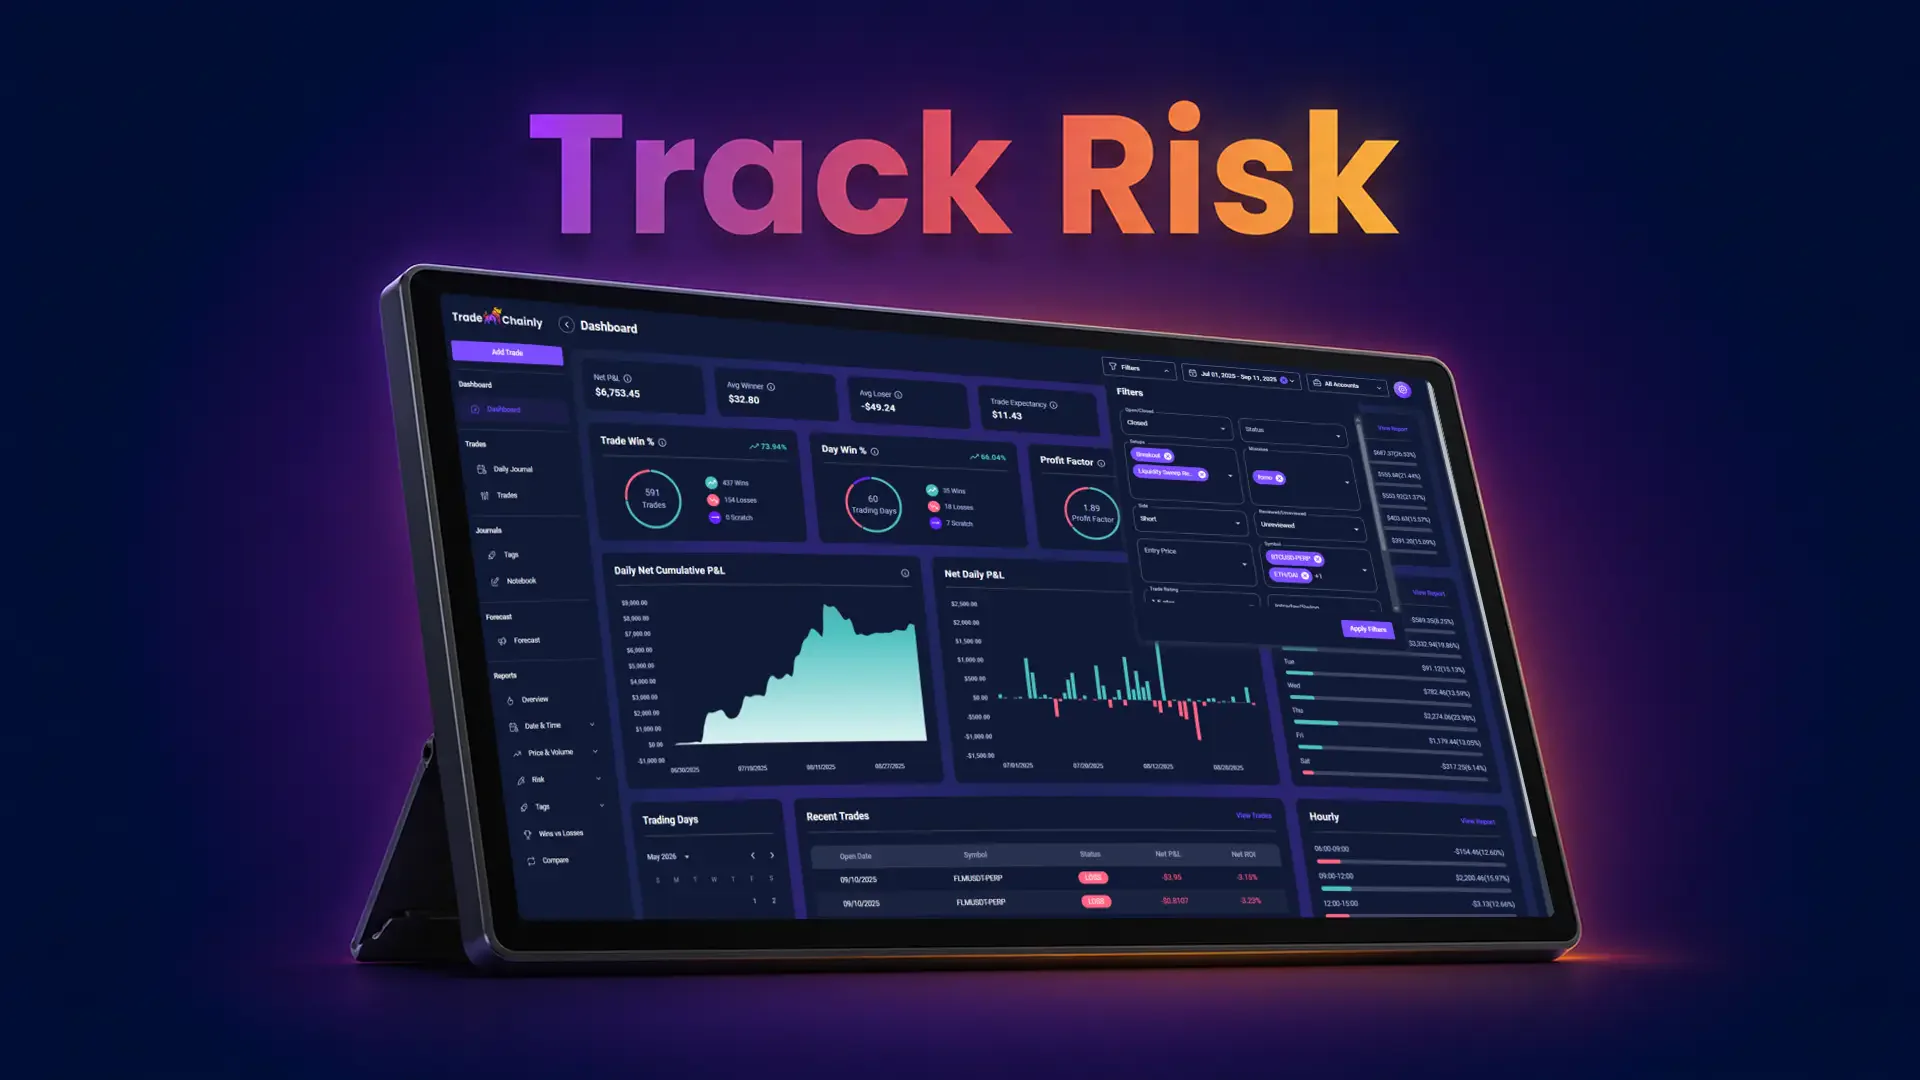
TradeChainly applies this concept directly into your trading journal. When you review your trades inside TradeChainly, you do not only see win rate and P&L. You also see the R-multiple for your trades, your setups, your tags, and your strategies. That turns R-multiple from a theory into a real performance metric you can measure every single day.
Once you start logging R-multiple consistently, patterns begin to reveal themselves. You will see which setups produce high R winners. You will notice where you tend to cut winners early. You may even notice that your losing trades rarely exceed -1R, which means your risk discipline is strong. Or you may realize the opposite, which is exactly the kind of insight that helps you improve.
How TradeChainly Calculates and Tracks R-Multiple
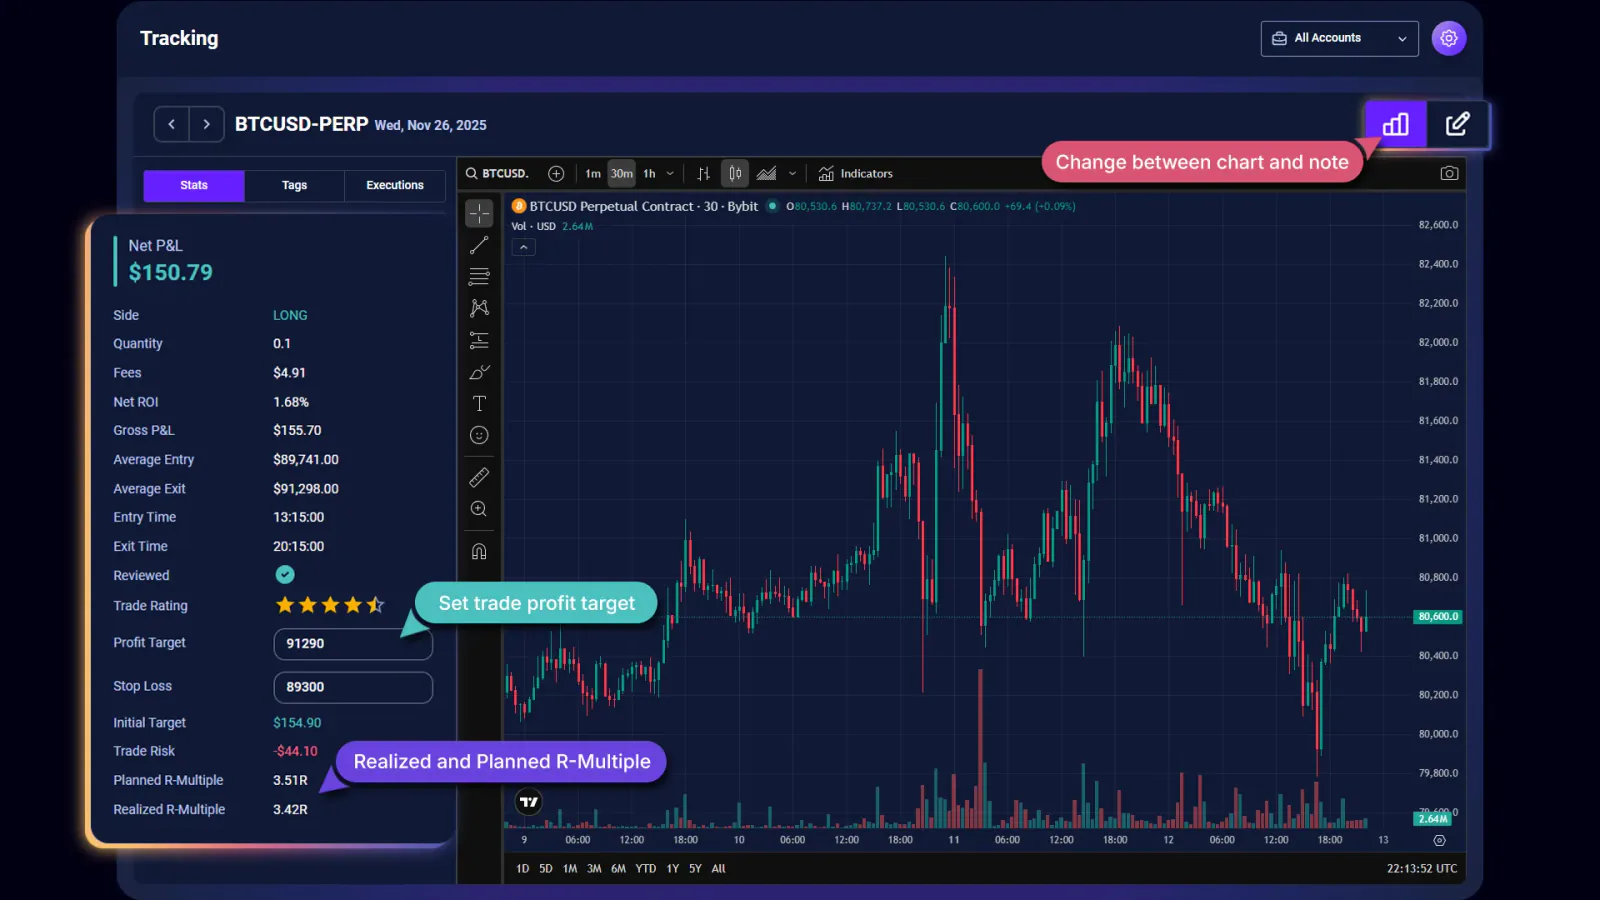
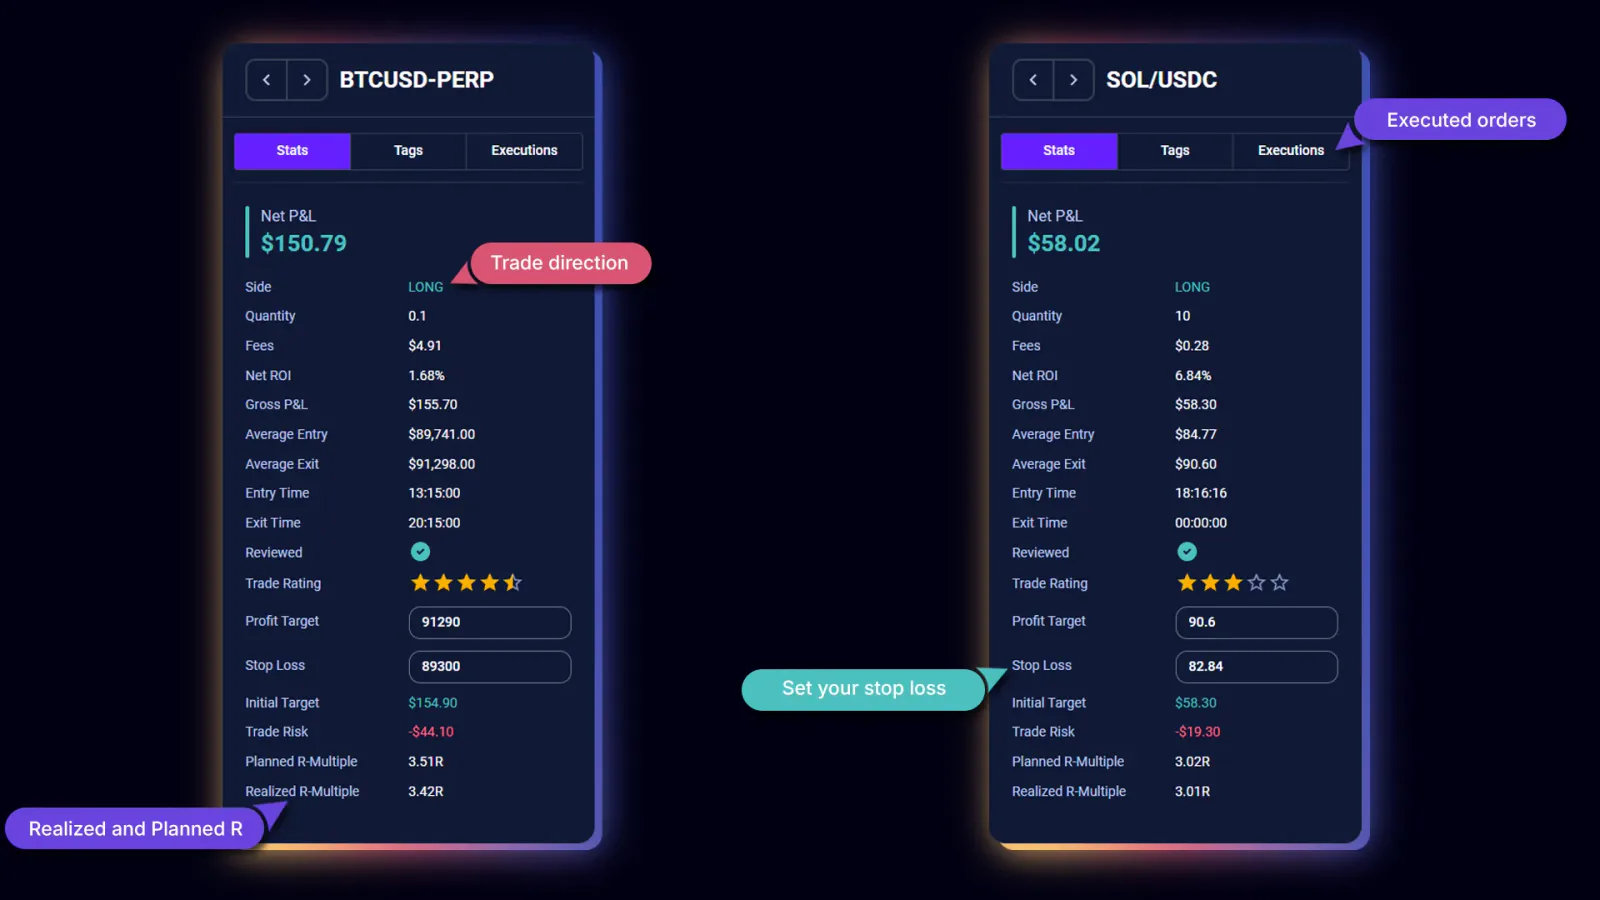
Now that you understand the concept of R-multiple, the next question is simple. How do you actually track it in real trading without spreadsheets or manual math? This is exactly where TradeChainly makes your life easier. The platform automatically calculates both Planned R-Multiple and Realized R-Multiple based on the information from your trade.
Planned R-Multiple is based on the risk you define before entering the trade. This requires three things: your entry price, your stop loss level, and your profit target. The distance between entry and stop defines your 1R risk. The distance between entry and target defines your expected reward. So if your stop loss is $50 below entry, and your target is $150 above entry, your planned reward is 3R. That means the trade is structured with a 1:3 risk to reward profile.
Realized R-Multiple is calculated after the trade closes. This is based on your actual exit price and your original stop level. If you exited early, your realized R might be smaller than your planned R. If you held longer or trailed your stop, your realized R might be larger. TradeChainly records both values so you can evaluate the difference between your trading plan and your actual execution.
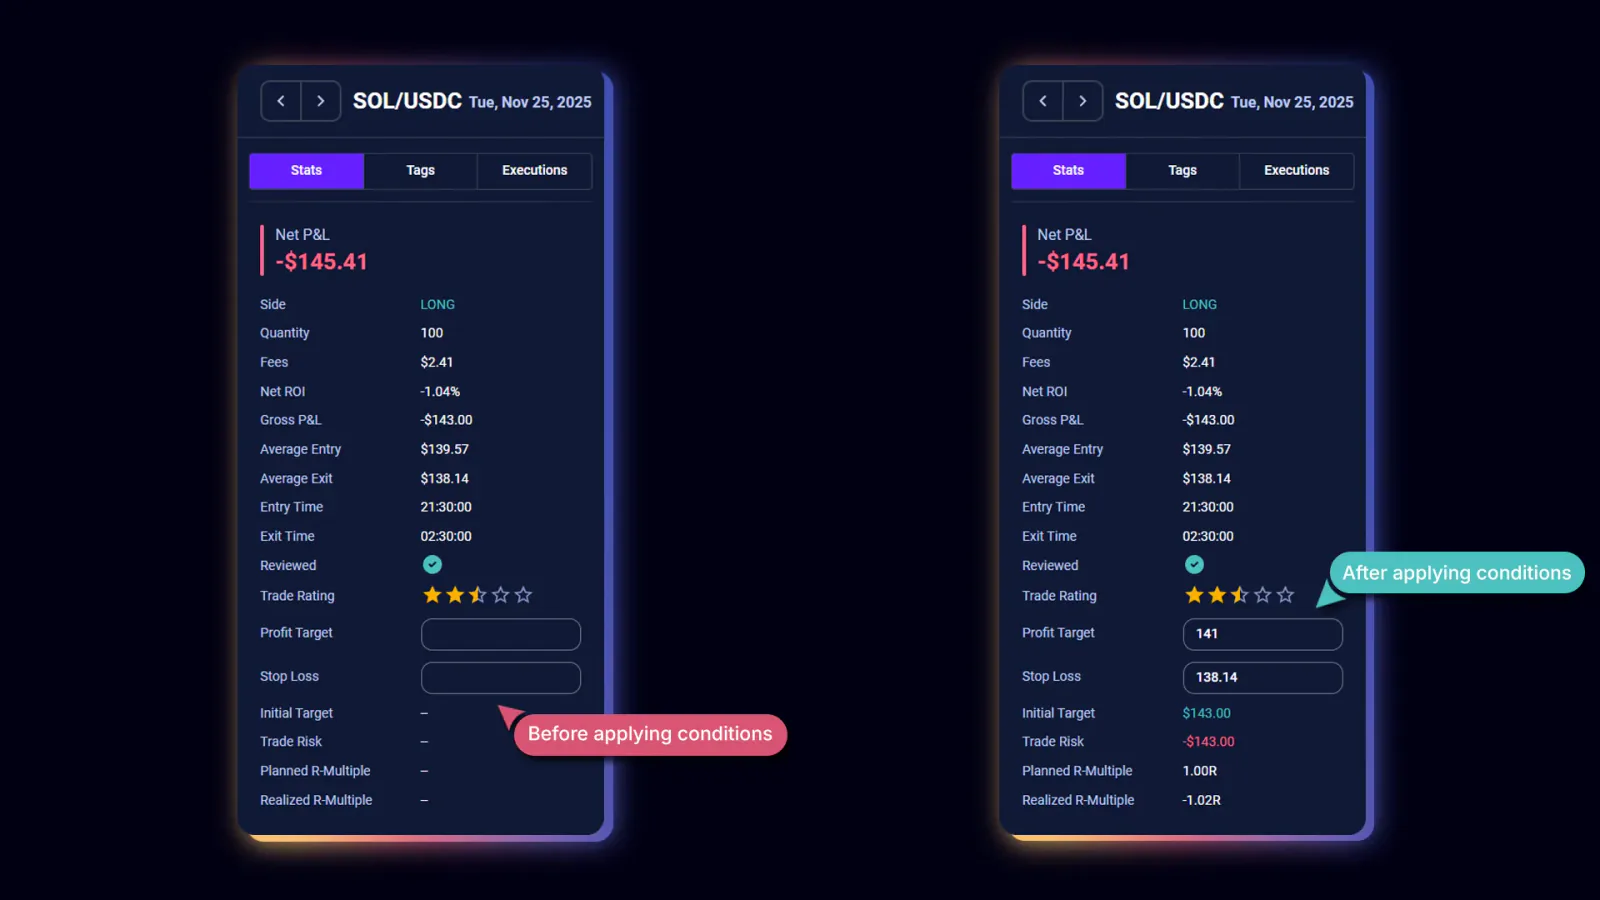
Inside TradeChainly, you will see R-multiple on the Trade Details page. When you open a trade, you can enter your profit target and stop loss. Once those values are stored, TradeChainly automatically calculates Trade Risk, Planned R-Multiple, and Realized R-Multiple. This helps you review every single trade through the lens of risk. You no longer need to guess how much you risked or how efficient the trade was.
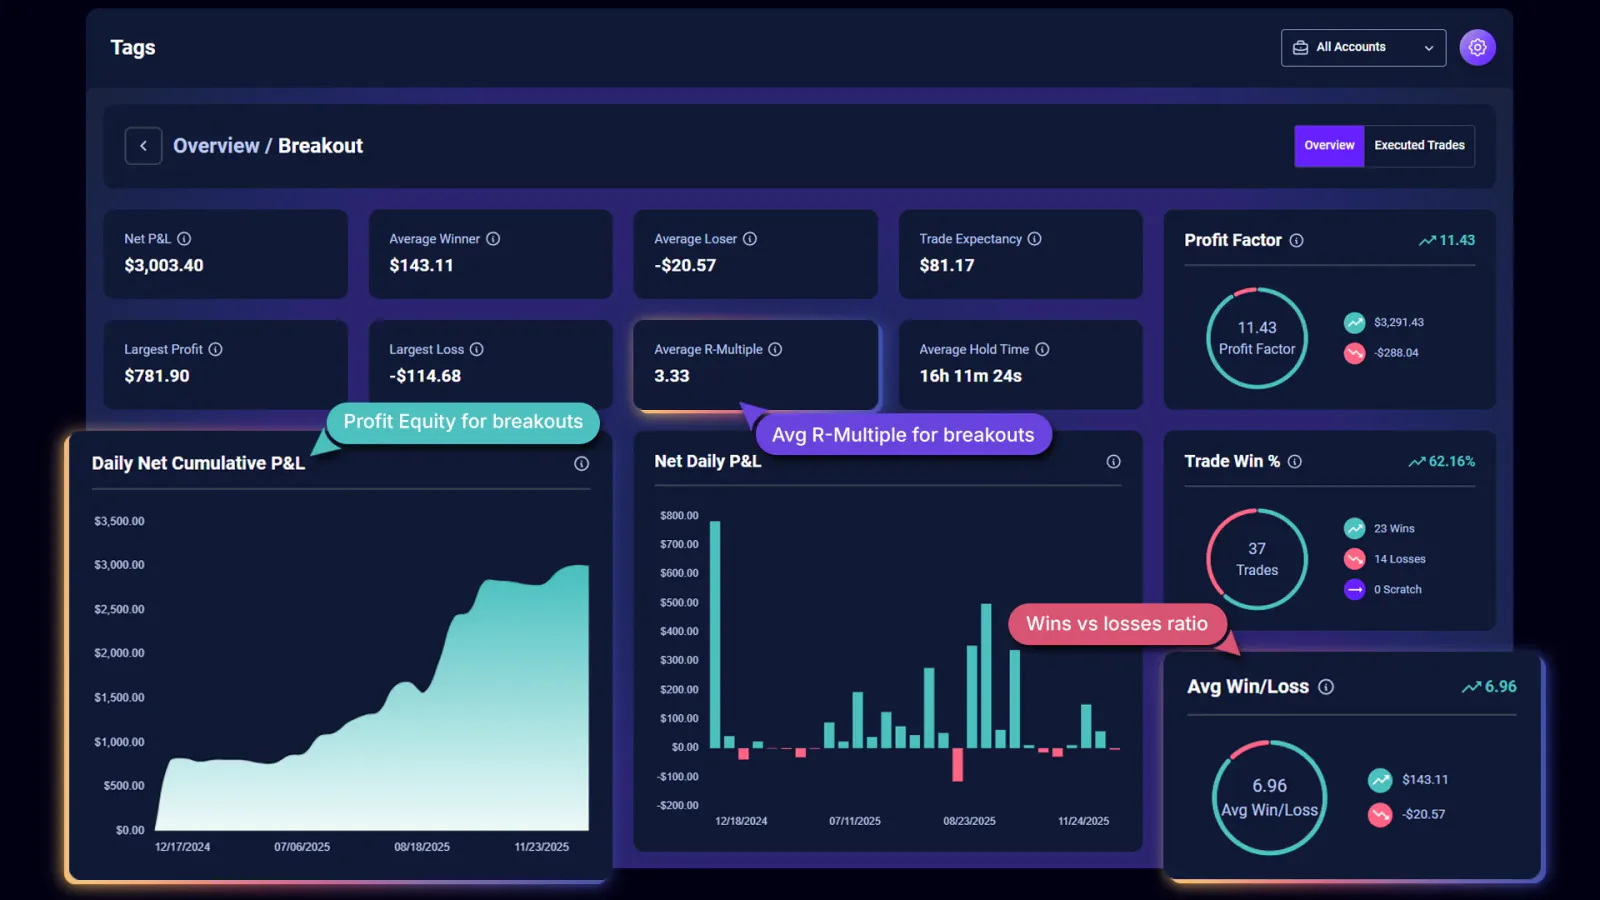
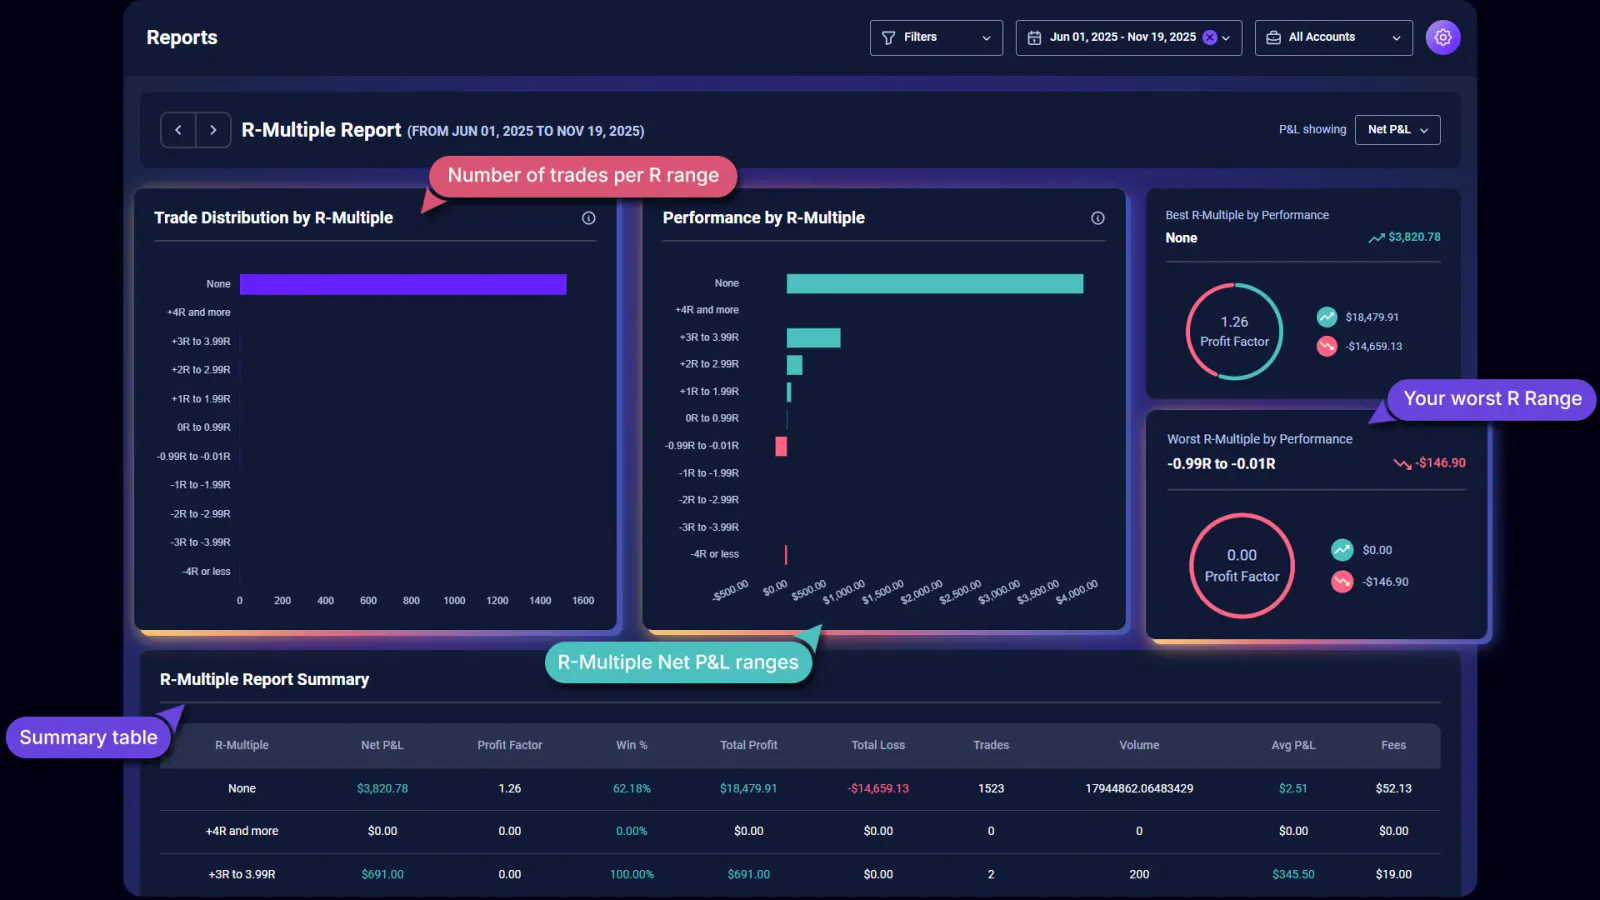
You will also see R-multiple used throughout other parts of the platform. When you analyze tags, such as setups or mistakes, TradeChainly shows the average R-multiple for that tag. This makes it clear which trading behaviors and strategies produce the best return per unit of risk. The same applies inside Reports. You can break down performance by duration, time of day, symbol, or volume, and see how R-multiple changes across conditions.
This is especially helpful for crypto traders because market behavior constantly shifts. Volatility expands and contracts. Liquidity moves between exchanges. Funding changes trader behavior. By tracking R-multiple automatically, TradeChainly gives you a consistent risk measurement across every environment. You can see whether you are executing your plan, whether you are letting winners run, and whether your losers are staying controlled around -1R.
The end result is clarity. You are no longer judging trades emotionally. You are reviewing them based on how much risk you took and how much reward you captured. Over time, you begin to refine your strategy around R, not around random profit goals or P&L swings.
Setting Risk Properly Before Entering a Crypto Trade
Most crypto traders enter a position first, then think about risk later. They buy or short based on a breakout, scalp setup, or bias from the chart, and only afterward start figuring out where the stop should go. That approach usually leads to oversized risk, inconsistent sizing, and emotional exits. R-multiple helps fix this because it forces you to define risk before you click the button.
The first step is choosing a logical stop loss level. In crypto, that might mean placing the stop below a swing low, under a consolidation range, or beyond a key liquidity level. The stop should represent the point where your trade idea is invalid. Once that stop is chosen, you can measure the distance between entry and stop. That distance is your 1R risk for the trade.
Next comes position sizing. This is where many day traders go wrong, especially when using leverage. If your account risk per trade is fixed, for example 1 percent, then your position size should change based on your stop distance. A tight stop means a larger position size is allowed. A wide stop means you must size smaller. TradeChainly helps you think in these terms so that your R risk stays consistent regardless of market conditions.
You can also plan your profit target before entering the trade. This might be a key resistance level, a measured move, or a certain R level like 2R or 3R. Once your target is defined, you now have a complete trade structure. Entry. Stop. Target. From here, R-multiple becomes easy to calculate, and your trade decisions become clearer.
Inside TradeChainly, you can record these values when entering or reviewing a trade. When you log your stop and target, TradeChainly automatically calculates your Planned R-Multiple. This allows you to evaluate whether your trades are structured efficiently. You might notice that your winning trades typically aim for 2R or higher, while your losing trades are capped around -1R. That is exactly the kind of risk profile that leads to long-term consistency.
Planning risk this way also reduces emotional pressure. You are no longer reacting to price on the chart. You already know your risk. You already know your goal. Your job becomes simple. Execute the plan. Review the results. Improve the process. TradeChainly supports that workflow by turning R-multiple into a measurable trading metric rather than a vague theory.
Reviewing Your Trades by R-Multiple Inside TradeChainly
Once you start planning trades using R-multiple, the real benefit comes from reviewing your results over time. TradeChainly makes this process simple because R-multiple is visible across multiple parts of the platform. You can open your Trades page, your Reports, or your Tag analytics and immediately see how much risk you typically take and how much reward you usually capture.
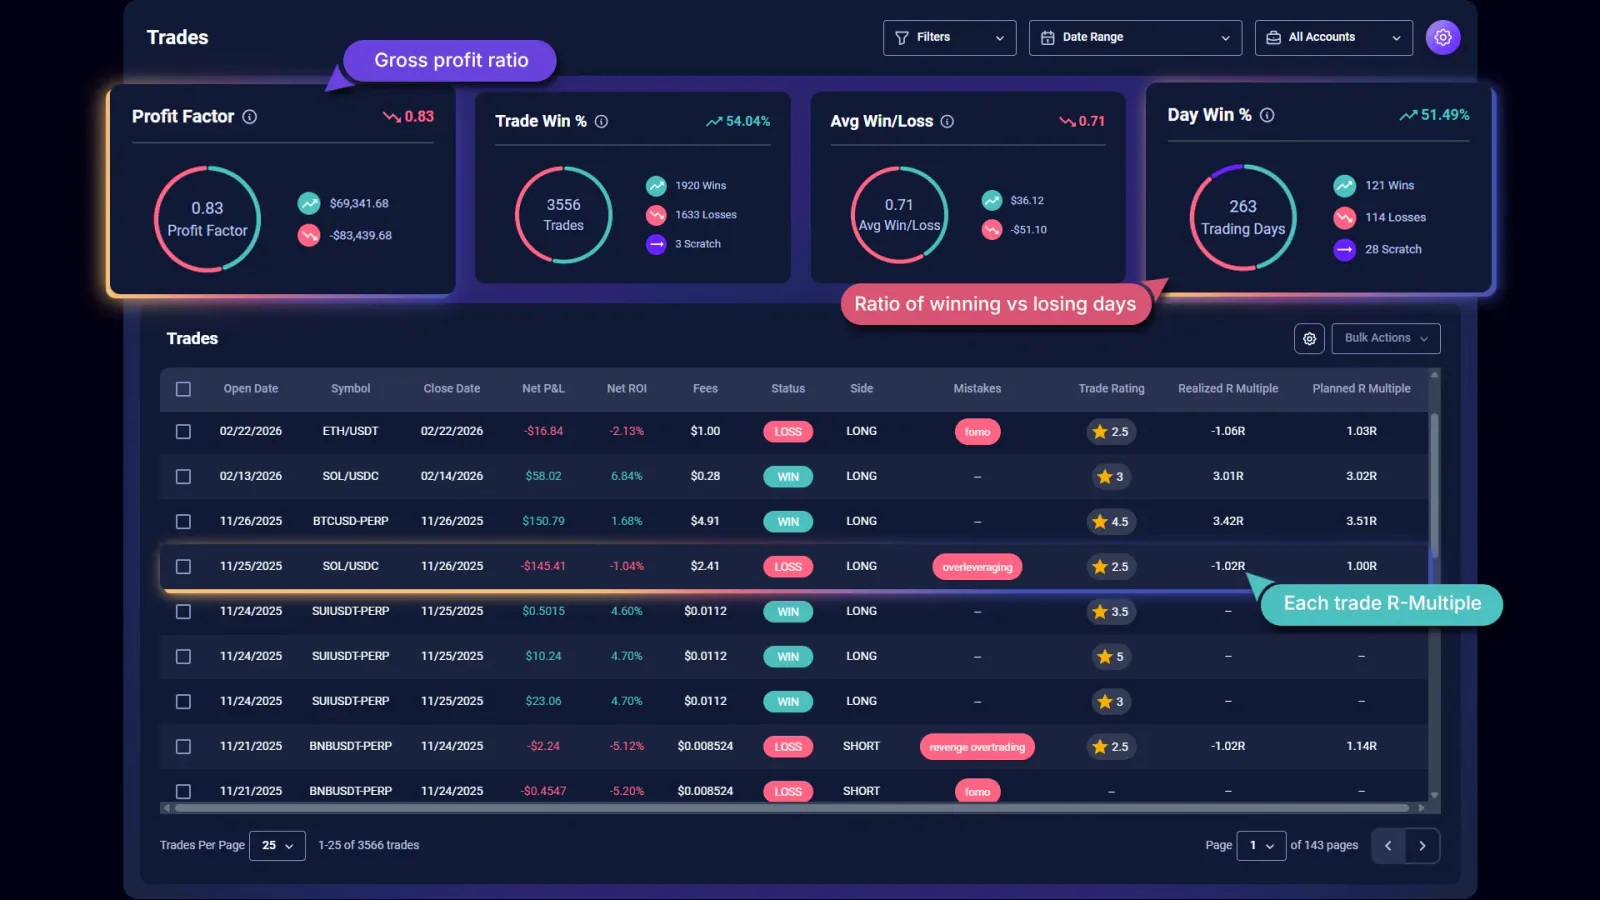
One of the most powerful workflows is sorting or filtering trades based on R-multiple. For example, you might want to see all trades where you lost more than -1R. If you notice several trades sitting at -2R or -3R, that is a clear sign that your stop discipline needs work. On the other hand, if your winners are capped at +1R, that might mean you are taking profits too early. R-multiple shines a light on these behaviors very clearly.
Another useful method is reviewing trades by setup or tag. TradeChainly allows you to tag trades based on strategy, such as breakout, pullback, scalp entry, momentum continuation, or reversal. When you look at the Tag Details page, you do not just see raw profit. You also see metrics like Average R-Multiple and Trade Expectancy. This tells you which strategies produce the best reward relative to risk, not just which ones resulted in the biggest dollar wins.
You can also combine R-multiple with time-based analysis. Inside TradeChainly Reports, you can break down your trading performance by hour, day, symbol, or volume. This helps you answer questions like: Do you take higher quality trades during certain market sessions? Do you overtrade during slower periods? Are your highest R winners coming from a specific pair like BTCUSDT or SOLUSDT?
When you look at your trades through this lens, you begin to separate luck from process. A big profit does not automatically mean a good trade. A small profit does not automatically mean a bad one. What matters is how much you risked and how consistently you captured positive R outcomes.
TradeChainly turns this into a repeatable review habit. After each trading day or week, you can log in, scan through your Realized R-Multiple values, and quickly understand whether you traded according to plan. If your R curve is positive over time, that usually means your strategy is valid. If your R curve is inconsistent or negative, you now have the clarity needed to adjust your approach before losses stack up.
How R-Multiple Improves Discipline, Execution, and Consistency
Most traders think that consistency comes from finding the perfect strategy. In reality, consistency usually comes from controlling risk and executing the same process repeatedly. R-multiple supports that mindset because it gives you a fixed way to define success and failure. Instead of chasing random profit targets, you start aiming for clean, repeatable R outcomes.
One of the biggest improvements is emotional control. When you think in dollars, every trade feels heavy. A $300 loss might feel painful, even if it was only -1R based on your risk plan. A $100 win might feel insignificant, even if it was a +2R trade on a smaller position. Thinking in R removes those emotional biases. A -1R loss is simply the cost of doing business. A +3R win is a high-quality outcome, regardless of the dollar amount.
Execution discipline also improves. When your goal is to protect -1R and target positive R outcomes, you naturally start setting stops and planning exits more consistently. You stop averaging down into losing positions because you know that pushes your risk beyond your predefined R. You stop randomly closing winners early because you now evaluate exits based on R, not fear of giving back open profit.
TradeChainly reinforces this behavior by recording your Planned and Realized R-Multiple on every trade. When you review your history, you can see whether you followed your plan or not. If you regularly cut trades early at +0.5R, that pattern becomes clear. If your losing trades often exceed -1R, that pattern also becomes clear. This feedback loop helps you self-correct without guessing.
Over time, this leads to a sense of control. You no longer feel like the market is deciding your fate. You decide your risk. You decide your structure. The market only decides whether the trade plays out or not. When that mindset clicks, trading becomes less stressful and more systematic. R-multiple is the measurement tool that keeps you anchored to that structure, and TradeChainly is the platform that tracks it for you so you always know where you stand.
Realistic Crypto Trading Examples Using R-Multiple in TradeChainly
Sometimes the best way to understand R-multiple is to see it applied in real trading scenarios. Crypto markets provide endless examples because volatility and leverage amplify both mistakes and good execution. When you log these trades inside TradeChainly, the R-multiple calculation gives you a clear way to judge the quality of each result.
Here is the first example. Imagine you are scalping Bitcoin on Binance futures. You risk $200 based on the distance between your entry and stop loss. Price moves in your favor and you close the trade for a $600 profit. In dollars, that feels like a good win. In R terms, this was a +3R trade. TradeChainly records this as a high quality winner, and when you review your journal later, you will clearly see that this setup delivered three times the risk you exposed.
Now consider a second trade. This time you take a position on SOLUSDT. Your risk per trade is still $200, but volatility is higher so your stop loss is wider and the position size is smaller. The trade hits your target and you make $250. Many traders see this as “less impressive” than the Bitcoin win. But in R terms, this is actually about +1.25R. Not bad, but not nearly as strong as the BTC trade. Without R-multiple, those trades feel hard to compare. With R-multiple, the difference is crystal clear.
For the third example, imagine a common losing streak. You take three trades in a row and all three get stopped out. Each one was structured with -1R risk. That means your total loss for the streak was -3R. A few days later, you catch a strong breakout and hold for +4R. Now your overall result across four trades is +1R. Even though you had three losses and one win, the strategy is still profitable. TradeChainly makes it easy to see this risk math over time instead of reacting emotionally to short-term results.
This is exactly why professional traders think in R instead of dollars. R-multiple gives you a stable frame for decision making. It shows you that one strong winner can offset several small losses. It also shows you when your losing trades are too large or when your winners are not big enough to justify the risk.
When you review these examples inside TradeChainly, everything becomes part of your data history. You can tag setups, track performance across accounts, and evaluate how your average R evolves over time. That is the kind of structured feedback loop that turns trading from chaos into a refined process.
Conclusion
R-multiple is one of the simplest and most powerful tools for improving your risk management as a crypto trader. It forces you to define risk before the trade, measure results consistently, and review your execution based on process rather than emotion. When you think in R instead of dollars, you remove a lot of the noise that normally drives impulsive decision making.
TradeChainly is built to support that way of thinking. The platform tracks both Planned and Realized R-Multiple so you can evaluate your trades with complete clarity. You can see whether you stuck to your plan, whether your average winners are large enough, and whether your losers stay controlled around -1R. Over time, those insights help you refine your strategy and build real consistency.
Crypto markets move fast. Leverage magnifies both mistakes and opportunity. The traders who survive and eventually thrive are usually the ones who treat risk as a fixed cost and focus on capturing positive R outcomes over time. If you want a structured way to review your trades and track R-multiple automatically, TradeChainly gives you that framework without spreadsheets or manual calculations.
If you are serious about improving your crypto trading performance, start measuring your trades in R. Then let TradeChainly help you track, analyze, and refine your results. Small improvements in risk discipline compound over time. That is often the difference between inconsistency and confidence as a trader.