Why Do Liquidations Feel “Inevitable” in Crypto Futures?
If you trade crypto futures long enough, liquidation starts to feel inevitable. You can be disciplined for days or weeks, stack small wins, then one fast move wipes out a chunk of progress. Most traders file this under “that’s leverage” and move on.
That framing is convenient, but it’s wrong.
Liquidations are not random. They are the end result of a series of decisions that compound under volatility. Leverage choice. Stop placement. How much margin you leave unused. Whether you cut the trade when it is clearly wrong or wait for “one more push.” In crypto, those decisions are punished faster and harder because the market never closes and liquidity can vanish in seconds.
A losing trade and a liquidation are not the same thing. A loss is part of a strategy’s distribution. A liquidation is a forced exit caused by running out of margin before your idea has a chance to fully play out. That distinction matters, because only one of those tells you something is structurally wrong with how you manage risk.
Most traders treat liquidation as an emotional failure. They replay the moment price spiked, the wick that shouldn’t have been there, or the news that hit out of nowhere. What they rarely do is step back and ask a more useful question: why was this position fragile enough to be liquidated in the first place?

Crypto’s structure makes this problem worse. Perpetual futures combine high leverage, 24/7 trading, and sudden volatility expansions. A setup that looks “fine” in calm conditions can become lethal during a funding flip, a liquidity sweep, or a cascade triggered by forced liquidations elsewhere in the market. If your margin buffer is thin, you do not need to be wrong by much to be gone.
Journaling changes the conversation. When you stop labeling a trade as simply “liquidated” and start treating liquidation as a data point, patterns emerge quickly. Certain setups. Certain sessions. Certain leverage levels. Certain emotional states. None of that shows up if liquidation lives only as a bad memory.
I’m not going to promise you a world where you never get liquidated again. That’s unrealistic for active futures traders. The point is to track liquidations properly, analyze why they happen, and reduce them systematically without neutering your strategy. When liquidation becomes feedback instead of trauma, it stops repeating in the same way.
What Data Is Hiding Behind a Liquidation?
By the time a liquidation happens, the real mistake is already behind you. The forced exit is just the final print. What matters is the data that led up to it, and most traders are flying blind here.
Ask a trader why they got liquidated and you will usually hear something vague. Too much leverage. Volatility was crazy. Price wicked me out. None of those explanations are wrong, but they are incomplete. They do not tell you what actually failed in your risk structure.
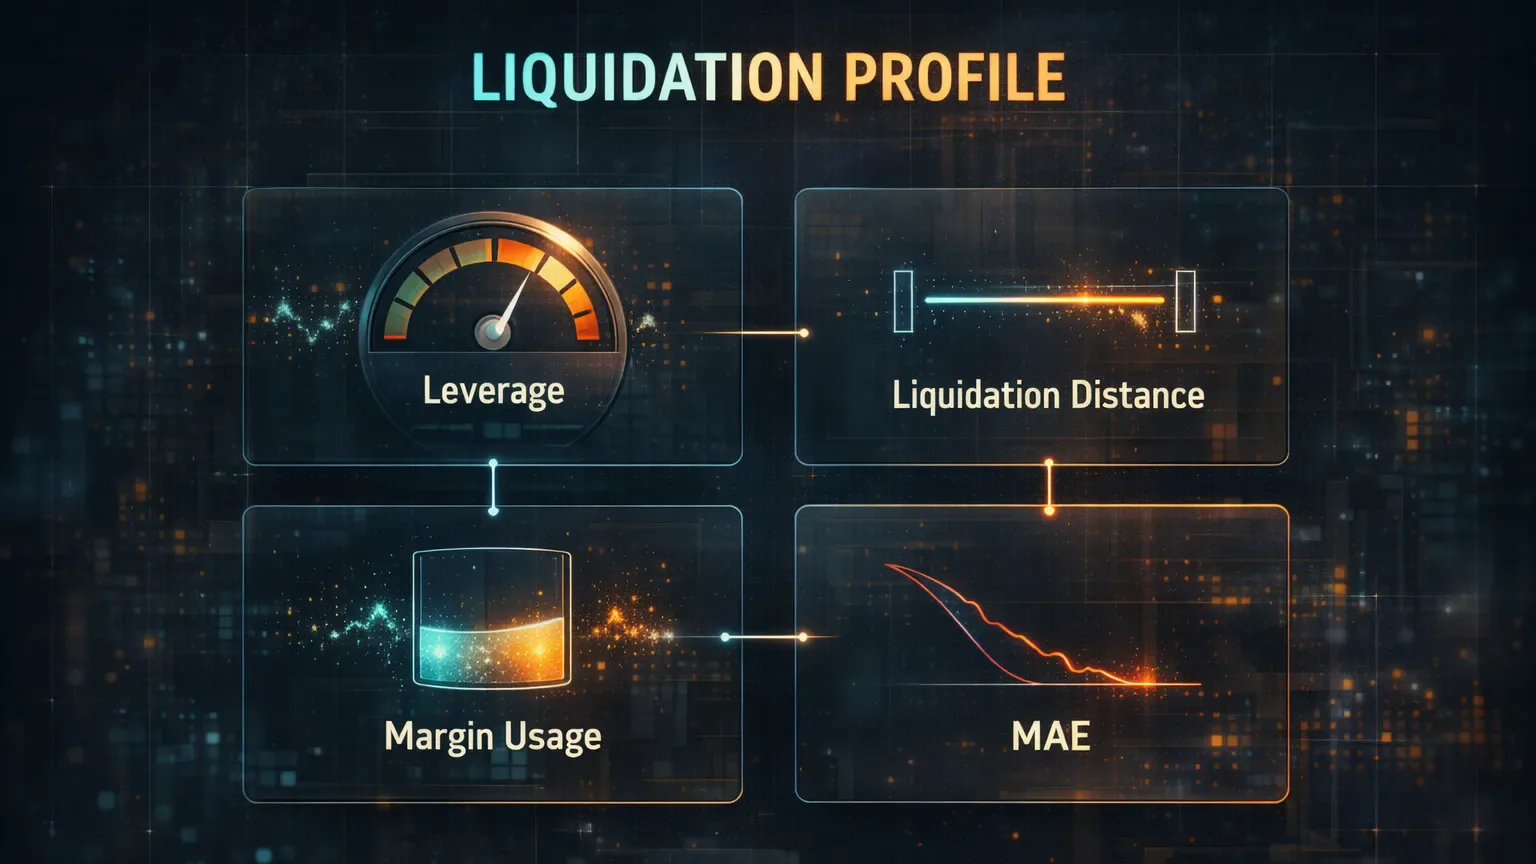
Every liquidation has a measurable profile.
Start with leverage at entry. Two traders can take the same BTC or ETH setup and have completely different outcomes because one used 3x and the other used 12x. The higher the leverage, the closer your liquidation price sits to normal market noise. If your journal only records direction, entry, and exit, you lose that context entirely.
Now look at liquidation distance. How far was price from your liquidation level when you entered the trade? Not in percentages you eyeballed on the chart, but in actual price distance relative to recent volatility. Many liquidations happen not because a setup was bad, but because the trader gave the market less room than it regularly needs to breathe.
Margin usage is another blind spot. Traders often size positions based on what feels comfortable, not on how much of their account is actually at risk if the trade goes against them. Using 40 percent or 60 percent of available margin on a single idea might feel efficient, but it leaves you no flexibility when price moves fast or when funding, fees, or slippage stack up.
Then there is MAE, maximum adverse excursion. This is one of the most underused metrics in crypto journaling. MAE tells you how far price moved against your position before it resolved. When you look at MAE across liquidated trades, a painful truth often shows up. Many of those trades were clearly invalid long before liquidation, but they were held anyway.
One more thing: “I knew this could happen” is not a metric. Knowing something emotionally does nothing if you cannot see it repeated in your data. Without tracking leverage, liquidation distance, margin usage, and MAE together, liquidation stays abstract. It feels unlucky instead of predictable.
For example, consider an altcoin futures trader who mostly trades SOL and a rotating list of high-beta names. Their win rate looks fine. The equity curve grinds upward, then every couple of weeks there’s a crater. When they finally pull the liquidations into one view, the pattern is embarrassingly consistent. Same leverage used for clean A-tier setups and late entries. Similar MAE to normal losing trades. The difference wasn’t “how wrong” the trades were. The difference was how thin the margin buffer was.
Once you start recording these variables consistently, liquidation stops being a mystery. It becomes a recognizable outcome that shows up under the same conditions again and again. And once it is recognizable, it is fixable.
Why Do Liquidations Cluster Instead of Showing Up Randomly?
One of the first things you notice when you start reviewing liquidation data is that they rarely happen in isolation. They cluster. Same days. Same sessions. Same types of market behavior. This is not coincidence. It is structure.
Crypto markets are reflexive, especially in perpetual futures. When price moves fast in one direction, liquidations themselves become fuel. Forced exits push price further, which triggers more forced exits. If you are positioned with tight margin during one of these moves, you are not trading your setup anymore. You are standing in front of a wave.
Volatility expansion is the most obvious trigger. Many traders size positions based on how calm the market looked a few hours earlier. Then volatility expands, ranges double, and what used to be a reasonable buffer becomes irrelevant. Liquidations often spike right after volatility transitions, not during steady trends.

Liquidity conditions matter just as much. Weekend trading is a classic example. Volume thins out, order books get shallow, and wicks stretch further than expected. A stop that would normally be hit cleanly on a weekday can turn into a liquidation on a low-liquidity Sunday move. If your journal does not separate trades by day or session, this pattern is easy to miss.
Funding rates quietly push traders into danger zones as well. When funding is heavily positive or negative, traders tend to overstay positions to “earn” funding or avoid paying it. That bias keeps them in trades longer than planned, often with leverage unchanged. Many liquidations happen not because the trade idea failed, but because the trader refused to exit while funding pressure built against them.
There are also exchange-specific nuances. Liquidation engines differ slightly between platforms like Binance, Bybit, and OKX. The exact mechanics are not always transparent, but what matters for journaling is consistency. If most of your liquidations happen on one exchange during fast moves, that is not noise. It is a signal that your margin buffer is not aligned with how that venue behaves under stress.
When you group liquidated trades by market condition instead of by emotion, the picture sharpens. Certain environments expose weak risk structures. Others barely touch them. That distinction is where real improvement starts, because it tells you when your approach is fragile and when it is robust.
What Should You Actually Record When a Trade Gets Liquidated?
Most trading journals treat liquidation as a checkbox. The trade ended in liquidation, tag it, feel bad, move on. That approach wastes the most valuable information the trade could give you.
A single “liquidated” tag is almost useless. It lumps together very different failures and hides the reason they keep repeating. If you want liquidation data to actually change your results, you need a more granular framework.
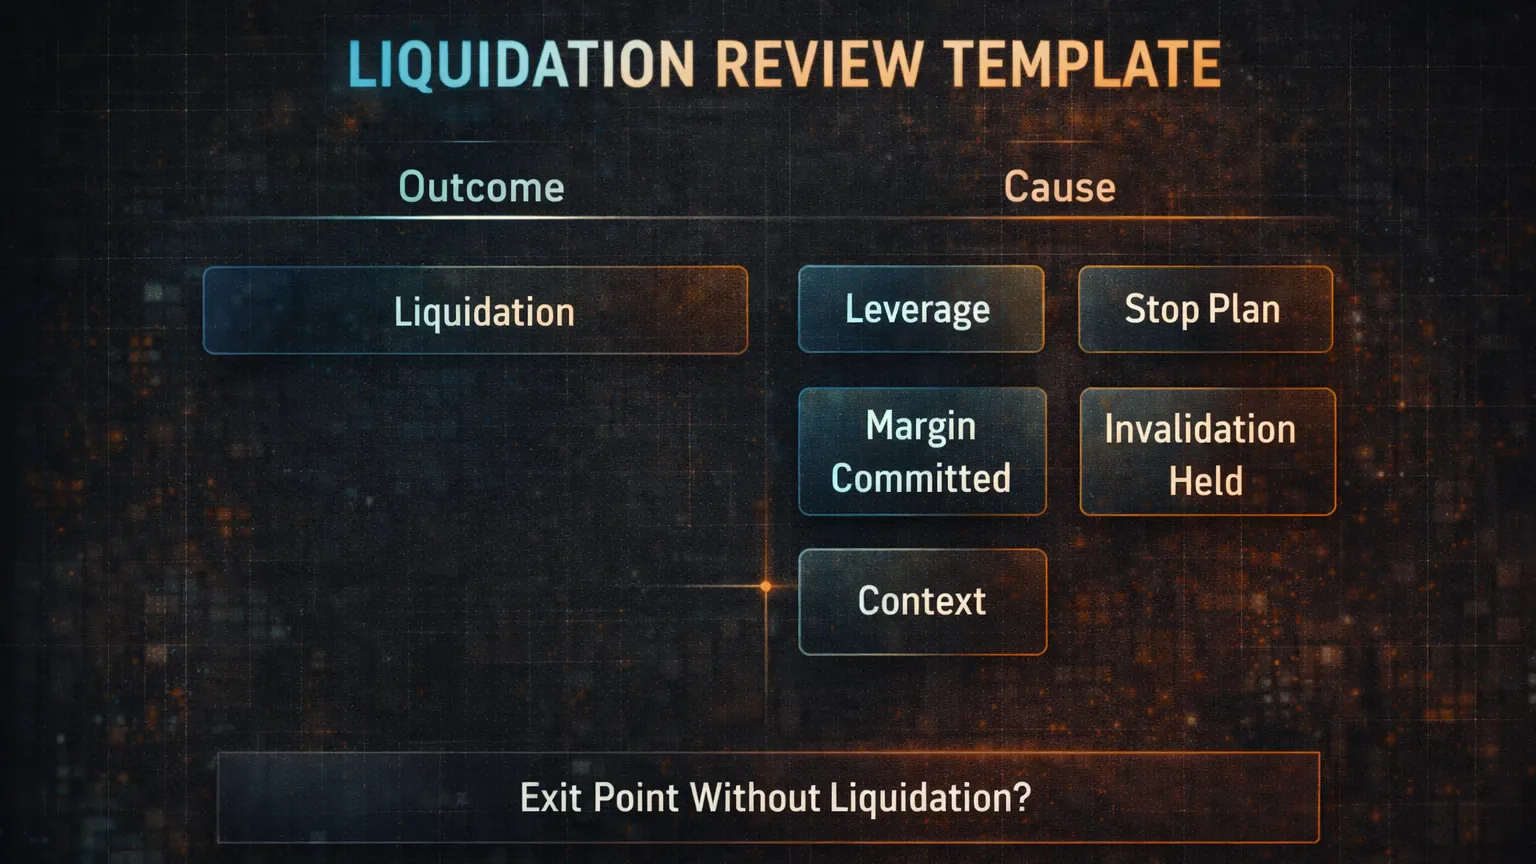
Separate the outcome from the cause. The outcome is liquidation. The cause is why your position became vulnerable. That might be excessive leverage for the setup, entering too close to a key level, holding through invalidation, or committing too much margin to one idea. Those causes should be reflected in your tags or notes, not buried in memory.
Pre-trade leverage deserves its own field or tag. Not just “high” or “low,” but the actual leverage used. Over time, patterns show up fast. Many traders discover that most liquidations happen above a specific leverage threshold, regardless of market or setup quality.
Planned stop versus liquidation price is another critical comparison. If your planned stop is already close to liquidation, you are not really using a stop. You are hoping. Journaling this gap forces honesty. It shows whether you had real risk control or whether the trade was structurally fragile from the start.
Context matters too. Was the trade taken during a high-volatility session? Was funding extreme? Were you tired, chasing, or revenge trading after a loss? These are not excuses, but they are data. When the same context keeps appearing before liquidations, it deserves attention.
Finish with one sentence that forces clarity: when should this trade have been exited if liquidation was not an option? That single line often reveals that the trade was invalid long before margin ran out. Over dozens of reviews, this becomes one of the most powerful liquidation-reduction tools you can use.
A proper liquidation journal does not shame you for blowing up a trade. It dissects the conditions that made the blow-up possible. When liquidation is documented with structure instead of emotion, it stops being an endpoint and starts becoming a diagnostic.
So How Do You Cut Liquidations Without Killing Your Edge?
Go back to that altcoin futures trader example. Once the pattern is visible, the fix is rarely “trade less” or “be more careful.” The adjustments that actually hold up are mechanical.
First, leverage becomes variable. A-tier setups keep higher leverage. Everything else is sized down automatically.
Second, enforce a minimum distance between entry and liquidation price. If that distance cannot be achieved with reasonable position size, the trade is skipped. No debate in the moment. No “it’ll be fine this time.”
After a month, the win rate barely changes. The strategy edge is still there. What changes is the distribution of losses. Liquidations drop sharply. Losing trades still happen, but they are controlled losses instead of account shocks.
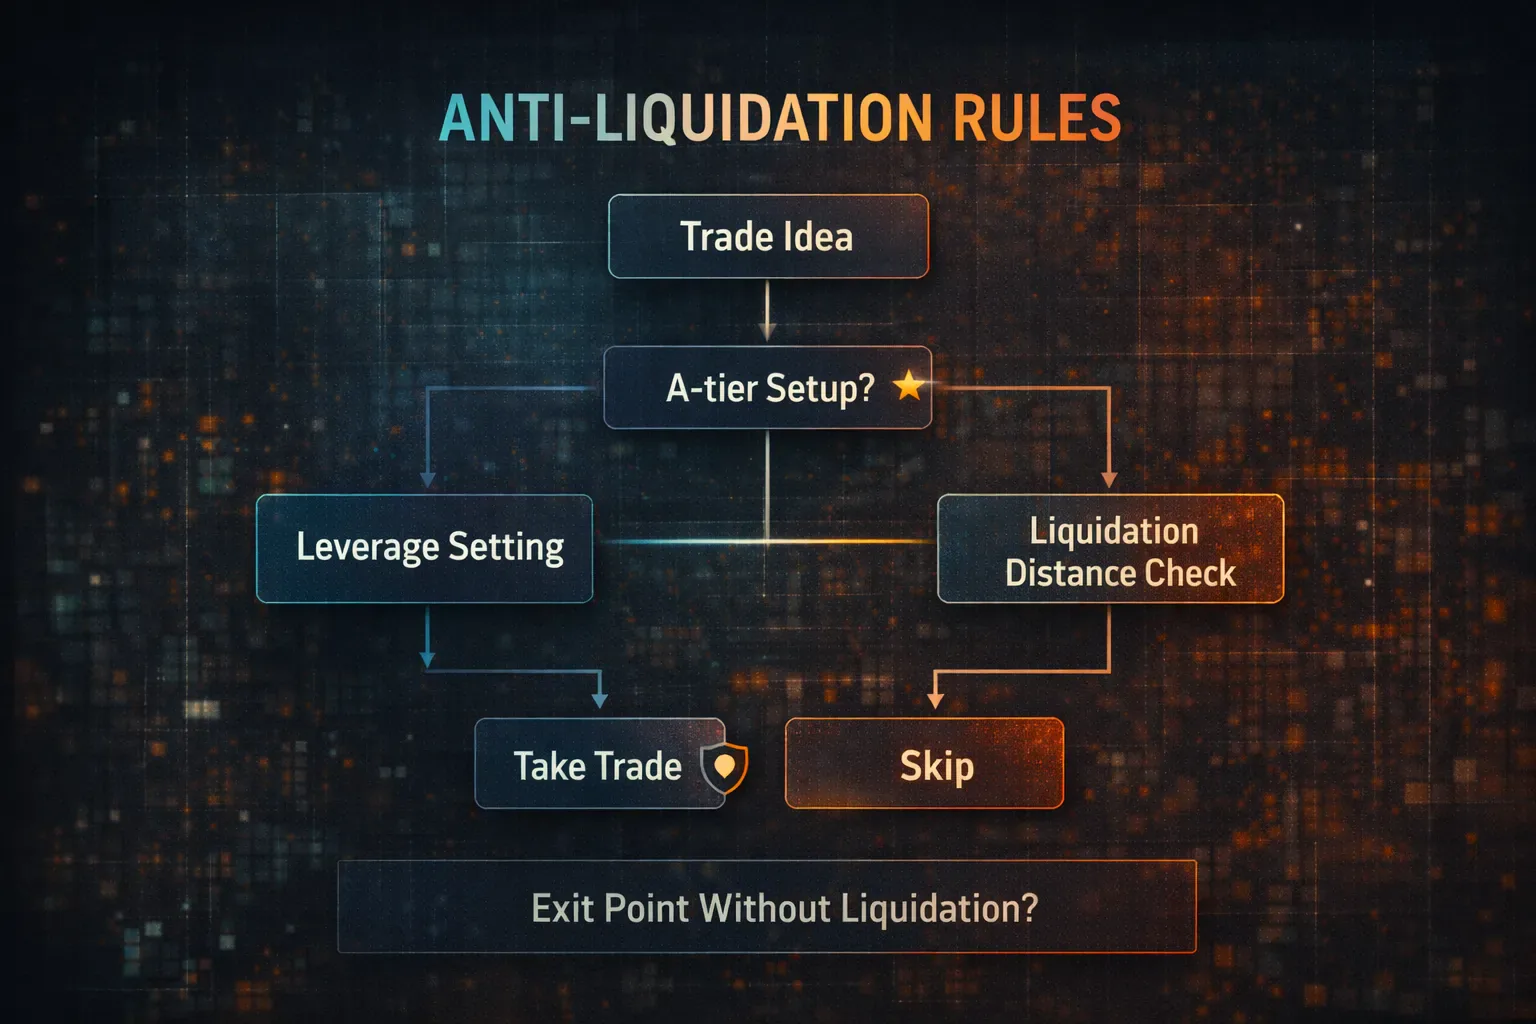
The pattern is clear: the strategy did not need fixing. The risk structure did. Liquidation was never the problem. It was the symptom.
It’s hard to get this kind of improvement without structured journaling. Without data, the trader keeps blaming execution or market conditions. With data, the fix becomes obvious and measurable.
In Practice, How Does This Fit Into a Journal Workflow?
Understanding liquidation patterns is only useful if you can see them clearly in your workflow. Plenty of traders get stuck at this step. They know liquidation is bad, but their journal does not make it easy to isolate, compare, and review those trades in a meaningful way.
At a minimum, liquidated trades should be filterable. You should be able to pull up every trade that ended in liquidation and view them as a group, not one by one. Once grouped, the next step is context. Tags for leverage range, setup quality, session, and market condition turn a painful list into a readable dataset.
Trade notes matter here, but only if they are structured. A paragraph venting about a bad wick does nothing on review. A short note that captures why the trade stayed open, why size was not reduced, or why the stop was ignored gives future-you something to work with. Over time, these notes become reminders of decisions you do not want to repeat.
Metrics add another layer. Looking at MAE across liquidated trades compared to normal losers often reveals that liquidation is not about being wildly wrong. It is about refusing to accept normal adverse movement. When you can see that in your data, it becomes easier to cut trades earlier without second-guessing.
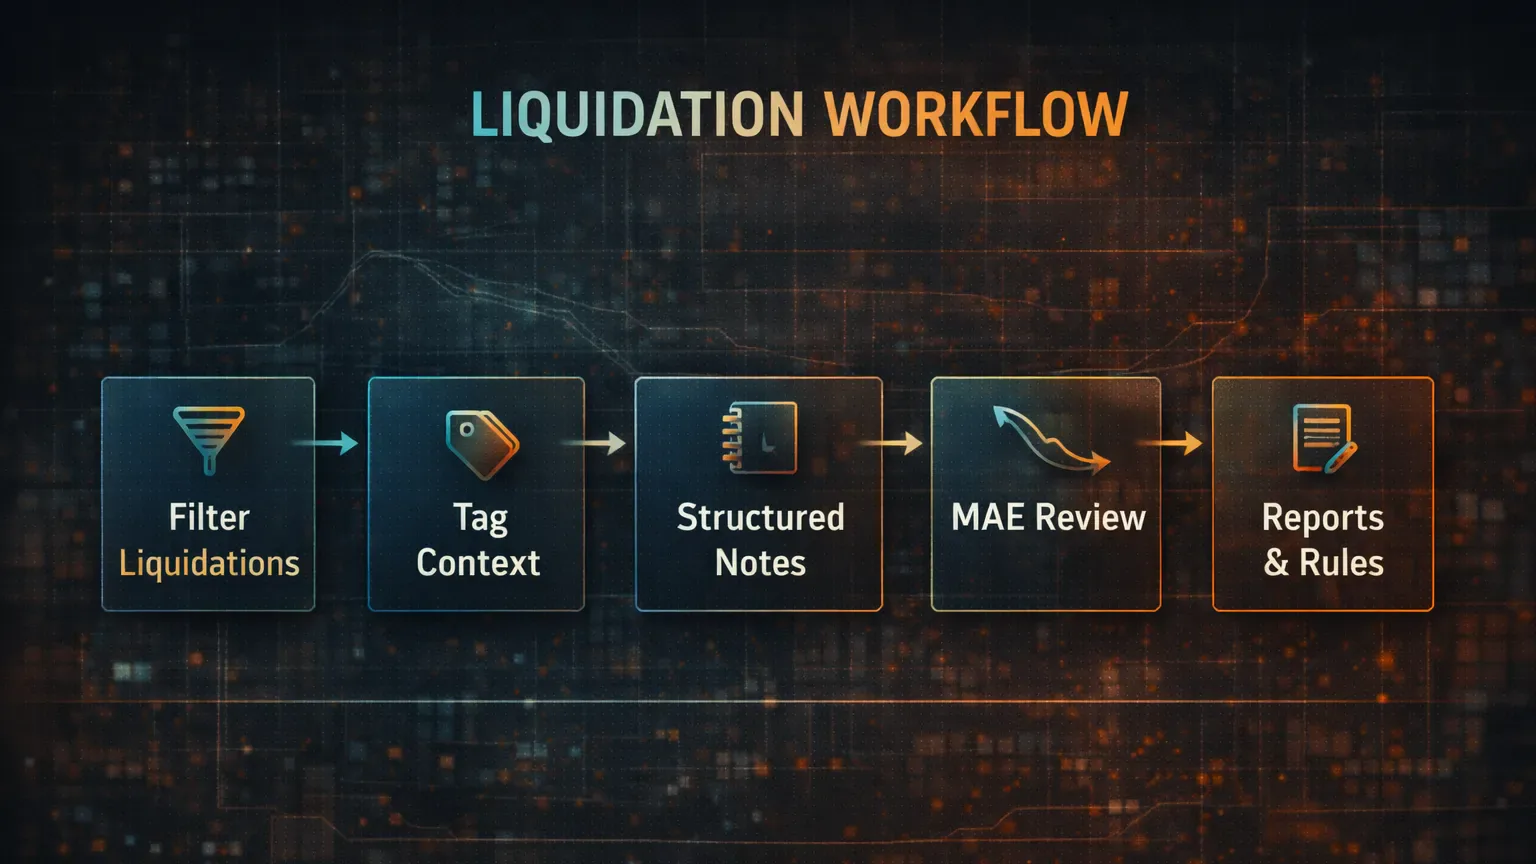
Reports are where the real leverage comes from. Grouping trades by tag or session and comparing liquidation frequency changes how you think about risk. You might find that one setup produces decent expectancy but carries disproportionate liquidation risk. That does not mean it should be abandoned, but it might deserve stricter sizing rules.
Automation matters for this, too. Manually logging trades often leads to missing fields, skipped reviews, or selective memory. A crypto-specific journal like TradeChainly, which continuously syncs futures trades from exchanges and lets you tag, filter, and analyze them, removes that friction. The less effort it takes to capture liquidation data, the more honest and complete that data becomes.
The goal of a liquidation-focused workflow is not to obsess over blown trades. It is to make liquidation patterns obvious enough that you adjust behavior before the next cascade hits.
What Changes When You Stop “Avoiding Liquidation” and Start Managing It?
Many traders approach liquidation with a simple goal: never let it happen again. That mindset usually backfires. It leads to fear-based decisions, premature exits, or avoiding good trades altogether.
A more useful shift is moving from liquidation avoidance to liquidation awareness. Instead of asking, “How do I make sure this trade cannot liquidate me?” ask, “How much adverse movement am I realistically exposed to if this trade goes wrong?”
Liquidation distance becomes a practical input, not a threat. If a trade requires tight margin to make the risk-reward work, that is information. You can respond by reducing size, waiting for a better entry, or passing altogether. None of those choices are emotional once the data is visible.
There are situations where traders knowingly accept higher liquidation risk. Short-term scalps during momentum bursts, for example, often rely on speed rather than room. The difference between intentional risk and reckless risk is whether you can see and quantify it beforehand. Journaling is what draws that line.
When liquidation is treated as feedback instead of failure, it loses its power to surprise you. It becomes another variable you manage, like drawdown or win rate. And like those metrics, it improves when you stop reacting and start measuring.

Where Does This Leave You?
Liquidations feel brutal because they are sudden and final. But in most cases, they are not unpredictable. They are the result of leverage, margin, and decision-making lining up poorly with market conditions.
If you never capture the data behind liquidations, they will keep feeling random. You will keep promising yourself to be more careful, without knowing exactly what that means. When you journal them properly, patterns surface fast. Certain leverage levels. Certain sessions. Certain behaviors under stress.
That clarity is what allows real progress. Not by eliminating risk, but by controlling it. Not by avoiding losses, but by preventing catastrophic ones.
A trading journal should help you see those patterns without friction. When liquidation data is easy to review and impossible to ignore, it stops repeating in the same way. That is where consistency starts, and that is where tools like TradeChainly fit naturally into a serious futures trader’s workflow.