Are Your Stats Actually Improving, or Are They Being Propped Up by Your Margin Mode?
Most crypto traders treat margin mode as a mechanical setting. You pick cross or isolated when opening a position, then focus on entries, exits, and PnL. The problem is that margin mode quietly changes the entire risk profile of your trading, and if you do not track it explicitly, your journal is lying to you.
Two traders can run the same setup, on the same market, with similar win rates, and end up with radically different equity curves purely because of margin mode. One absorbs drawdowns smoothly. The other blows weeks of progress in a single liquidation cascade. On paper, both may show similar average R-multiples until that hidden risk shows up all at once.
A Realistic Scenario: One Setup, Two Margin Modes
Consider a trader running a simple intraday momentum continuation setup on BTC and ETH perpetuals. Same entry model, same time windows, same risk intent. The only variable that changes is margin mode.
In isolated margin, the trader risks a fixed percentage per trade. Liquidation is close enough that stops matter, so trades are managed actively. Losers are cut quickly. Winners are taken in partials because holding through pullbacks feels expensive. Over a month, the equity curve is choppy but controlled. Drawdowns are frequent but shallow. The trader feels in control, even during volatile sessions.
Now take the same setup and switch to cross margin. Position sizes increase slightly because margin efficiency feels better. Trades survive deeper pullbacks, so the trader holds winners longer and feels less urgency to manage exits. The win rate improves. Average win increases. Confidence goes up.
Two weeks later, a fast market-wide selloff hits during low-liquidity hours. BTC and ETH drop together. Funding flips aggressively. Three open positions go deep red at the same time. None would have been catastrophic alone, but combined, they eat most of the available margin. A routine pullback turns into forced liquidation across the book.

When the trader reviews the journal, the difference is clear only because margin mode was tracked. Isolated margin days show consistent losses tied to individual trades. Cross margin days show fewer losses, but the worst day wipes out most of the month’s gains. The strategy itself did not change. Execution did not collapse. Risk expression did.
The biggest insight comes from emotional data. In isolated margin, the trader notes higher stress per trade but faster emotional recovery. In cross margin, stress stays low until it spikes sharply during portfolio drawdowns. Without journaling margin mode, this would look like a psychology problem. With proper segmentation, it is clearly a structural risk issue.
This is the kind of pattern that only appears when margin mode is treated as a first-class variable in your data. Otherwise, both months get averaged together and the lesson disappears.
Why Does Margin Mode Skew Your Performance So Hard?
Because crypto futures never close. Volatility spikes during low-liquidity hours, funding flips aggressively during trend extensions, and correlated pairs move together faster than most traders expect. Cross margin connects all of that risk whether you intend it or not. Isolated margin contains it, but often at the cost of tighter liquidation thresholds and different trade management behavior.
If your journal only tracks net PnL, win rate, or even expectancy without separating margin modes, you are blending two completely different risk engines into one dataset. The result is misleading confidence or unnecessary self-doubt. You might conclude that a strategy is unstable when the real issue is how margin exposure compounds across trades. Or you might believe your drawdowns are under control until cross margin turns a routine pullback into account-level damage.
Treat margin mode like a performance variable, not a preference. It affects drawdown depth, emotional pressure, position sizing decisions, and even how long you hold winners and losers. If you do not journal it deliberately, you are reviewing noise instead of signal.

What Actually Changes Between Cross and Isolated in Live Crypto Conditions?
The difference between cross and isolated margin looks simple. In practice, crypto futures turn that difference into something much more dynamic.
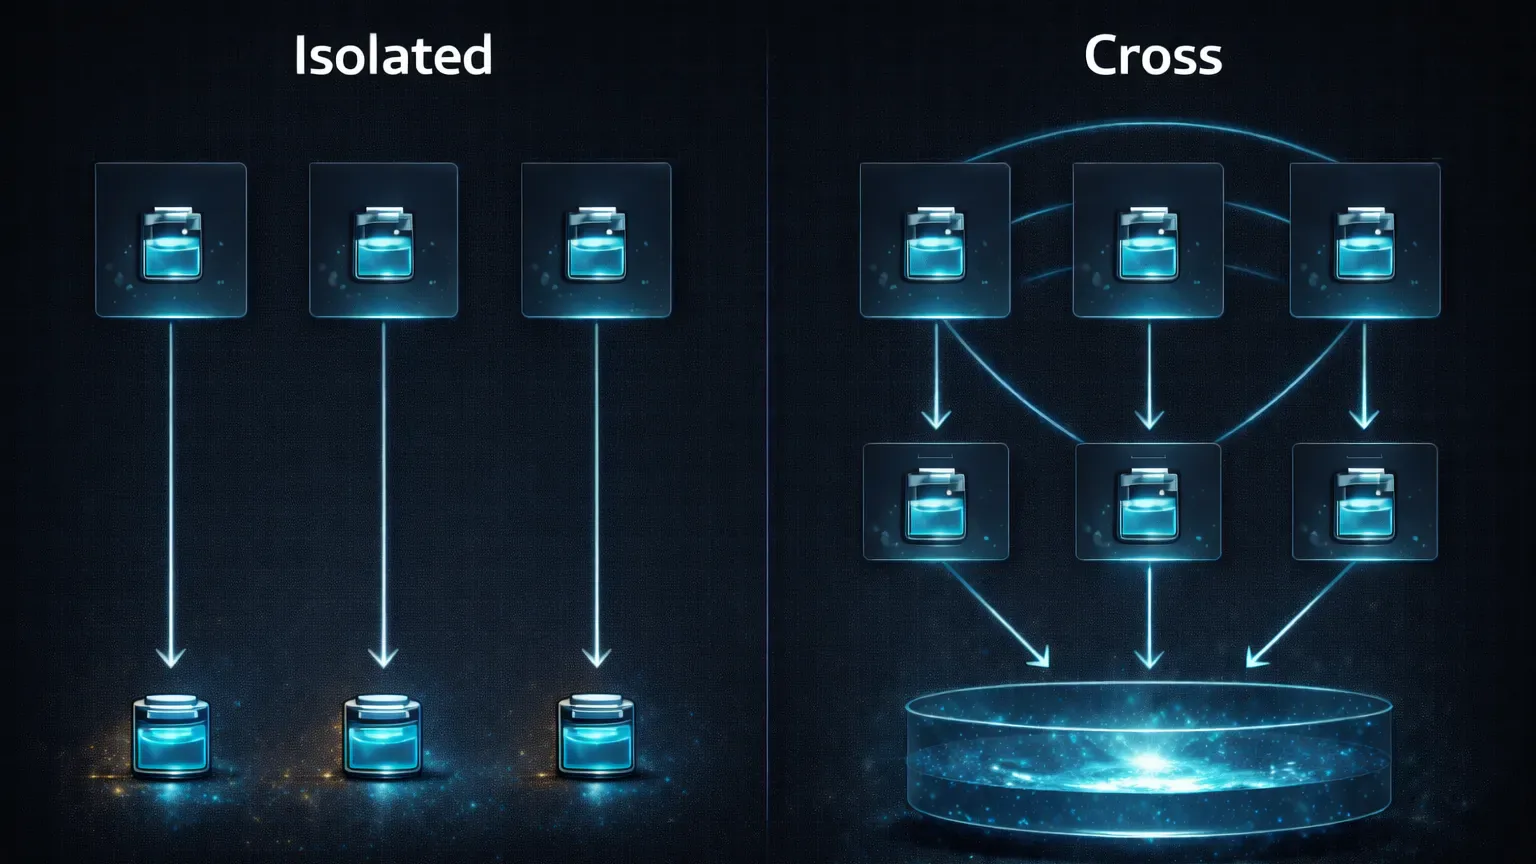
Isolated margin behaves like a hard box around a single position. Your risk is capped to the margin allocated to that trade. When volatility spikes, the position either survives within that box or it gets liquidated. This makes drawdowns easier to quantify and post-trade analysis cleaner. You can look at MAE, liquidation distance, and stop placement without worrying about what other positions were doing at the same time.
Cross margin works differently. All open positions share the same margin pool. That means unrealized losses in one trade can be offset by gains in another, but it also means correlated drawdowns stack quickly. In crypto, correlations increase exactly when volatility expands. During fast market-wide moves, BTC, ETH, and majors often move together. What looked diversified minutes earlier becomes a single leveraged bet.
Exchange behavior matters here. On Binance and Bybit, cross margin allows traders to run multiple positions with smaller individual margins, which feels efficient during stable conditions. On OKX, funding mechanics and margin calculations can shift liquidation risk faster during rapid price moves. The platform differences are subtle, but the outcome is the same. Cross margin amplifies system-wide exposure during stress.
Funding rates add another layer. In extended trends, positive or negative funding can slowly drain or support cross margin equity across positions. Isolated trades feel this as a per-position cost. Cross margin accumulates it across the entire book. Over a week of aggressive funding, that difference becomes visible in drawdown behavior even if your entries are solid.
Weekend liquidity makes this worse. Thinner order books and faster wicks increase liquidation risk, especially for cross margin portfolios that look balanced during high-liquidity sessions. Many traders only notice the problem after a sudden cascade wipes out gains from multiple days.
When you review performance, these mechanics matter more than most strategy tweaks. Two losing trades in isolated margin are just two data points. The same two trades in cross margin, combined with open exposure elsewhere, can become a single account-level event. If your journal does not separate these contexts, you cannot tell which results came from execution and which came from margin mechanics.
Which Metrics Get Distorted When You Mix Margin Modes?
Most traders think they understand their performance because they track the usual metrics. Win rate, average win, average loss, net PnL. The issue is that margin mode quietly bends these numbers in ways that are easy to miss unless you isolate the data.
Win rate is the first trap. Cross margin often inflates win rate because trades survive longer. Positions that would have been liquidated or force-closed under isolated margin stay open thanks to shared equity. Some of those positions recover and close green. On paper, that looks like better execution. In reality, you accepted more downside risk to achieve the same outcome.
Drawdown metrics are where the distortion becomes obvious. In isolated margin, drawdowns tend to be sharp and contained. You lose what you allocated to that trade, then you move on. In cross margin, drawdowns are smoother until they are not. Losses accumulate across positions, and when volatility expands, the drawdown accelerates faster than most traders expect. If you only track peak-to-trough equity without margin context, cross margin can look deceptively stable.

MAE and MFE tell different stories depending on margin mode. In isolated margin, MAE reflects how much heat a single trade took relative to its stop or liquidation price. In cross margin, MAE becomes blurred because liquidation distance depends on the entire portfolio. A trade may show a large adverse excursion without consequences one day, then trigger a cascade the next, even with similar price action.
Expectancy calculations suffer as well. Cross margin often produces higher average wins during strong trends because winners are held longer with less pressure. That same behavior magnifies losses when trends reverse quickly. Without separating margin modes, expectancy averages these extremes into something that looks acceptable but hides tail risk.
Reviewing performance without margin segmentation leads to false conclusions. You might cut a strategy that works well in isolated margin because cross margin losses are dragging the numbers down. Or you might scale a strategy that only survives because cross margin masks poor risk control. The data is not wrong. It is incomplete.
Margin mode determines how risk expresses itself in your metrics. If you do not account for that, you are optimizing the wrong variables and wondering why consistency never quite locks in.
How Do You Journal Margin Modes Without Turning It Into Busywork?
If margin mode changes how risk behaves, it has to be visible in your journal. Treating it as a note or assuming you will remember later is not enough. You need to be able to separate, filter, and review trades by margin context without friction.
The simplest approach is to make margin mode a tracked attribute for every trade. Not just cross or isolated, but consistent labeling that survives aggregation. When you review performance, you should be able to answer basic questions quickly. How do isolated margin trades perform on weekends? How deep do cross margin drawdowns get during high volatility days? Which margin mode produces cleaner execution for a specific setup?
Tags are the most practical way to do this. A dedicated tag for cross margin and isolated margin lets you slice reports instantly. Over time, patterns emerge that are impossible to see otherwise. You may discover that your breakout strategy works best in isolated margin but bleeds slowly in cross. Or that cross margin only makes sense when exposure is limited to a single asset.
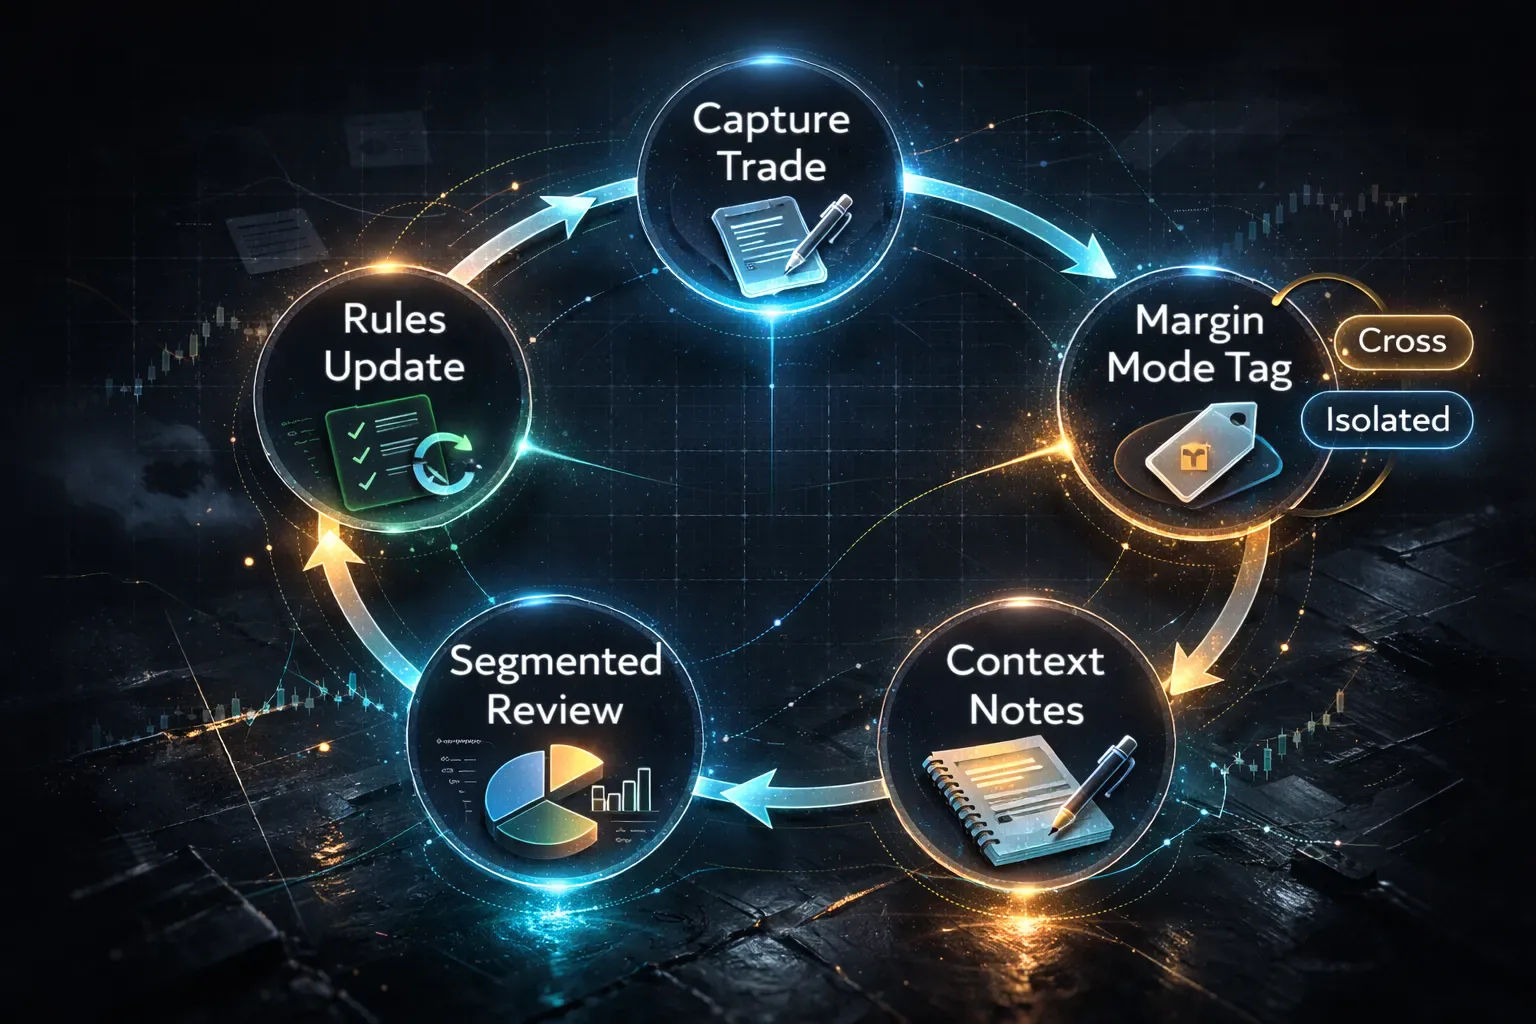
Notes add the second layer. Margin mode influences behavior, not just outcomes. In isolated margin, notes often mention tight stops, early exits, and frequent re-entries. In cross margin, notes drift toward “gave it more room” or “held through noise.” Seeing those phrases cluster around one margin mode is valuable feedback.
Reports and dashboards are where this becomes actionable. When margin mode is part of your review workflow, you stop arguing with your results. You can compare drawdowns, MAE, and expectancy cleanly. Tools like TradeChainly make this easier by keeping margin-related context tied to each trade through continuous sync and tagging, so reviews reflect how trades actually behaved, not how you remember them.
The goal is not to declare one margin mode superior. It is to understand how each one interacts with your execution style. Once that is visible in your data, risk decisions become intentional instead of reactive.
When Does Cross Margin Help, and When Does It Quietly Hurt?
Cross margin is not inherently reckless. It becomes dangerous when it is used by default instead of by design.
Cross margin can make sense when exposure is deliberately limited. A single position, or multiple positions that are tightly correlated by intention, can benefit from shared margin. Trend continuation trades during high-liquidity sessions are a common example. When volatility is directional and correlations are understood, cross margin reduces the chance of premature liquidation and allows winners to breathe.
The trouble starts when cross margin turns into accidental portfolio leverage. Holding BTC, ETH, and one or two large-cap alts at the same time feels diversified, but during fast market moves they often behave like one trade. In those moments, cross margin does not smooth risk. It concentrates it. Drawdowns accelerate precisely when decision-making degrades.
Risk perception shifts too. Cross margin lowers the immediate pressure of each trade, which often leads to looser stops and delayed exits. Individually, those decisions feel reasonable. Collectively, they raise account-level risk without obvious warning signs. Many traders only realize this after reviewing a month where most days were green but one session erased the progress.
Journaling is what makes the diagnosis obvious. If cross margin days show fewer losing trades but larger maximum drawdowns, that is not a psychology flaw. It is a structural mismatch between margin mode and execution style. Without separating those trades in your data, it is easy to misdiagnose the problem and make the wrong adjustment.
Cross margin works best when you already have strict exposure rules and respect correlation risk. If those rules are not written down and reviewed, isolated margin usually provides cleaner feedback and faster learning.
How Do You Turn Margin Mode Insights Into Rules You Actually Follow?
Once margin mode patterns are visible in your data, the next step is turning them into rules you actually follow. Insights that stay theoretical do not change results.
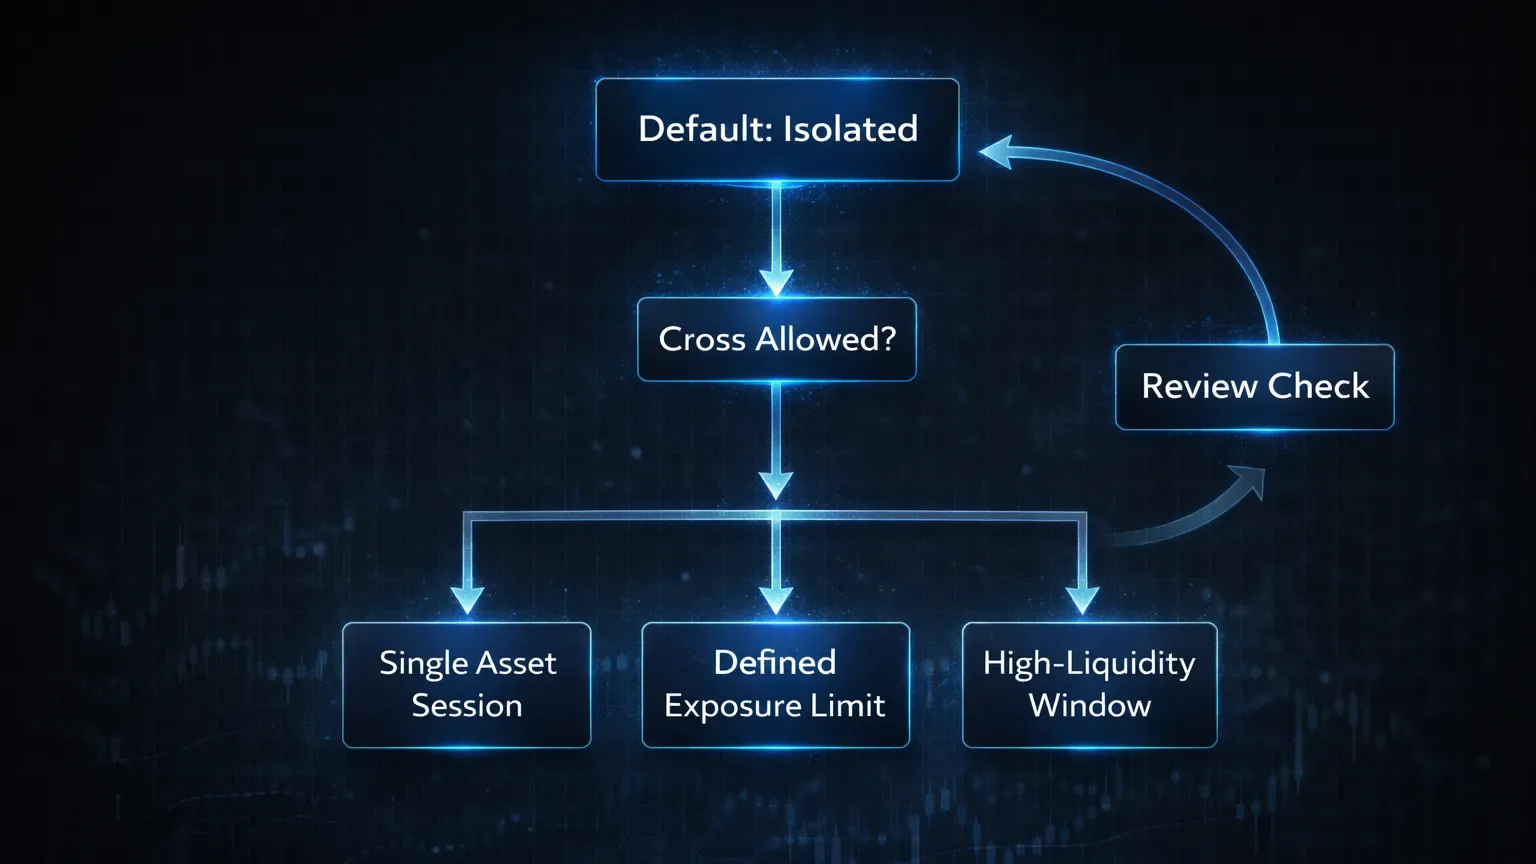
Start by defining default behavior. Many traders benefit from treating isolated margin as the baseline. It enforces trade-level accountability and makes mistakes cheaper. From there, cross margin becomes an exception, not a habit. When you choose it, the reason should be explicit and reviewable.
Rules should connect directly to what you observed in your journal. If cross margin drawdowns cluster during multi-position exposure, limit cross margin to single-asset sessions. If isolated margin shows frequent small losses during news-driven volatility, allow slightly wider risk only during specific windows. The key is that margin mode decisions come from evidence, not comfort.
Write these rules in the same place you review your trades. Margin mode rules belong next to setup rules and risk limits, not buried in a separate document. During review, check not only whether trades were profitable, but whether margin mode was used as intended.
Over time, this feedback loop sharpens execution. Margin mode stops being a background setting and becomes part of your strategy logic. That is when performance stabilizes. Not because volatility disappears, but because your risk structure finally matches how you trade.
What Changes Once You Treat Margin Mode Like a Strategy Variable?
Cross and isolated margin are not just different ways to fund a position. They change how risk accumulates, how drawdowns form, and how you behave under pressure. If you treat them as interchangeable, your performance data will always feel inconsistent.
The traders who gain clarity are the ones who separate margin modes in their reviews. They stop blaming execution for structural risk problems and stop over-crediting skill when margin mechanics carry trades further than expected. Once margin mode is tracked deliberately, the data becomes cleaner and decisions become calmer.
This does not mean you must commit to one mode forever. It means you choose each one with intention, backed by evidence from your own trades. That evidence only exists if your journal captures margin context accurately.
A crypto-focused journal like TradeChainly helps make that process practical by keeping margin mode, tags, and performance metrics tied to real trades through continuous sync. The tool matters less than the habit. Track margin mode as a first-class variable, review it honestly, and your risk management will finally reflect how crypto markets actually behave.
If you want more consistency, start there.