
Build Cost Awareness Before You Touch Your Strategy
Why does a strategy that “works” still fail to grow your account?
If you day trade crypto or scalp perpetual futures, you already know that small differences add up fast. One slightly late entry. One stop that slips. One position that sits open longer than planned. The market never stops moving, so the meter never stops running.
What many traders underestimate is how much of their performance is quietly drained by fees and funding rates. You can have a strategy that wins often and still watch your account stall or trend downward. On the surface it looks confusing. You are reading the market well. You are getting favorable entries. Yet your equity curve refuses to behave.

This problem is unique to crypto in its intensity. Perpetuals trade 24/7. Funding resets multiple times per day. Exchanges reward makers and punish aggressive takers. And leverage magnifies the hit that every fraction of a percent delivers.
So traders chase improvement in the wrong place. They tweak setups. Change indicators. Try to “fix discipline.”
When the real story is simpler:
Your strategy edge lives in one bucket. Your structural trading costs live in another.
Until you separate them, you are trading blind.
You might not have a strategy problem at all. You might have a cost problem. And those are solved in very different ways.
Spot the Leak With a Realistic Trading Story
Consider an altcoin futures trader scalping SOL and ETH perps on Binance. He trades often. Five to fifteen trades per session. Tight stops. Small targets. Good win rate at around 58 percent.
On paper, he feels competent. He reads momentum well. He avoids liquidation risk. His daily PnL fluctuates within a reasonable band.
But his account refuses to grow.
When he finally logs trades properly, the picture becomes clear.
Gross edge per day: +0.42R average
Fees per day: 0.35R average
Funding and slip: 0.12R average
Net result: slightly negative
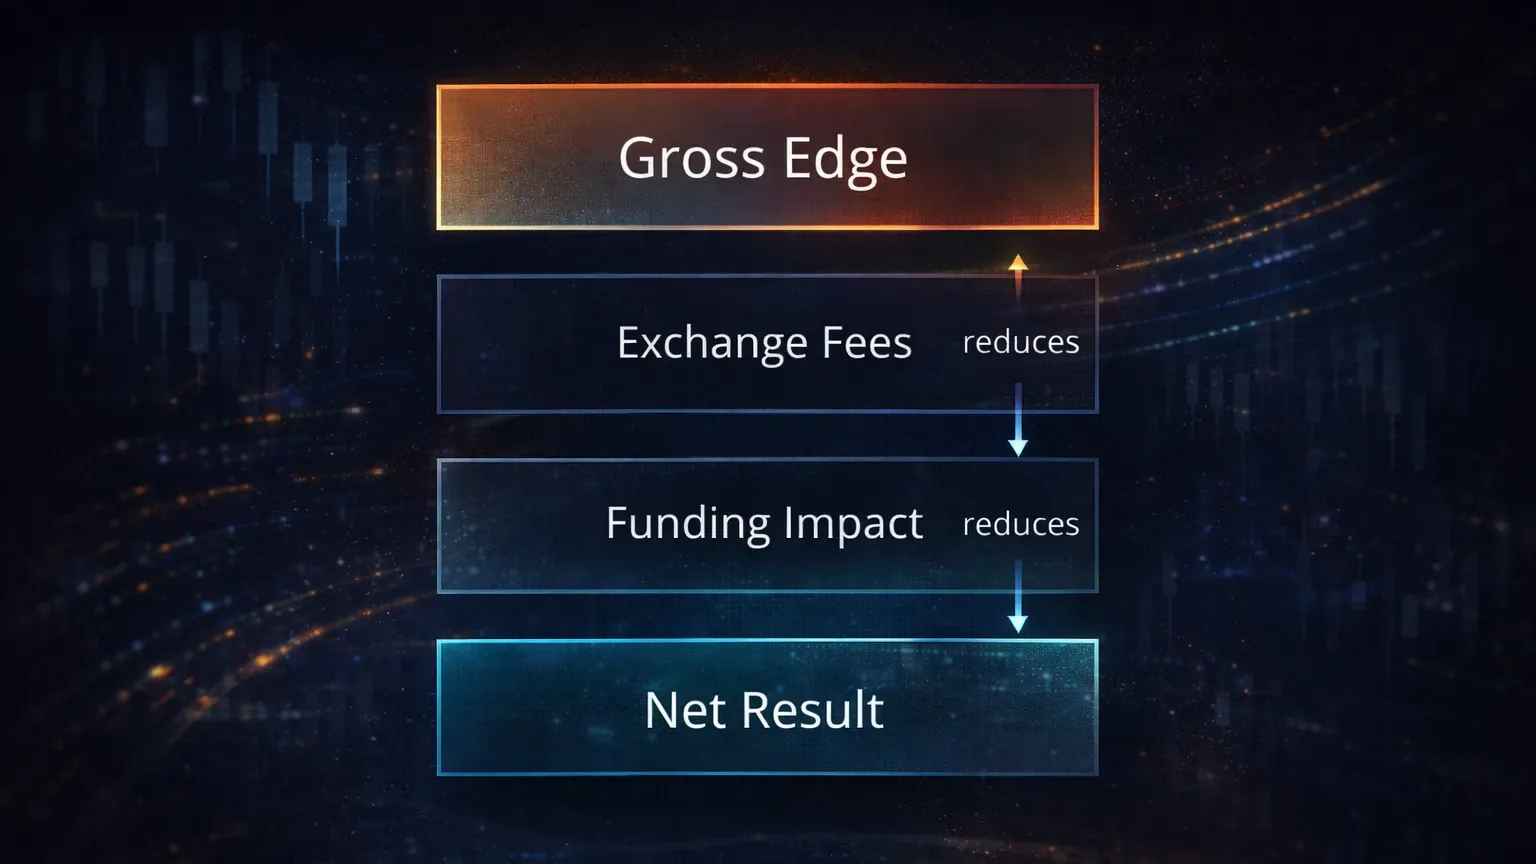
So the strategy works. The cost structure does not.
Instead of throwing away his approach, he refines it.
He shifts part of his execution to limit orders where liquidity allows. He reduces unnecessary scaling and stops chasing entries that are already gone. He avoids holding positions during high funding spikes unless the setup justifies it. He starts tagging trades based on cost exposure and reviewing them weekly.
Thirty days later the numbers change:
Gross edge remains similar. Fee burden drops. Funding exposure lowers. Net PnL moves into consistent positive territory.
He did not need new indicators. He needed visibility.
That is the power of tracking costs properly.
Map Funding Into Your Results Over Time
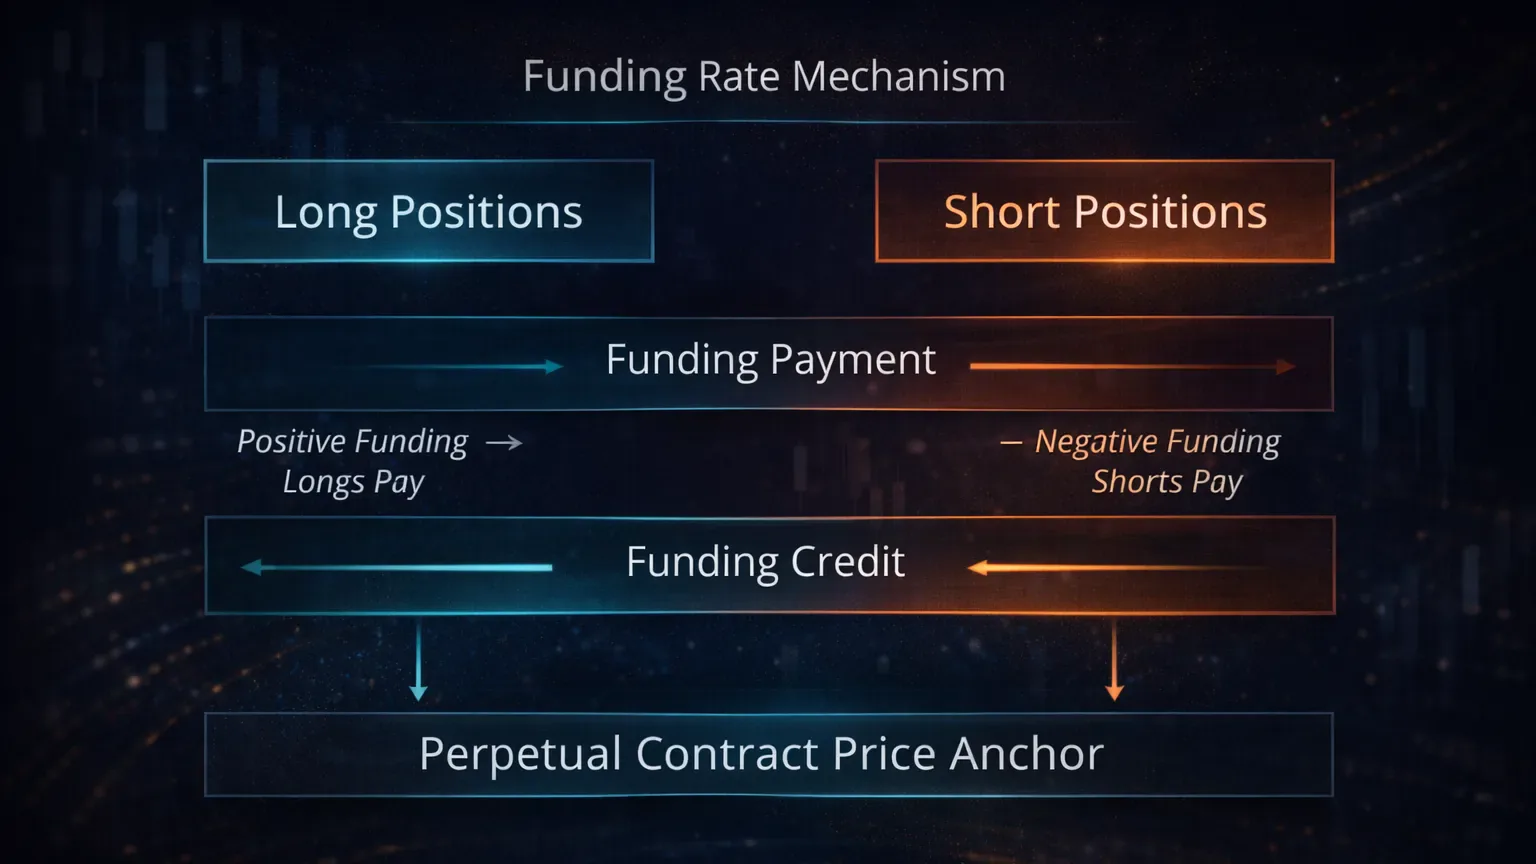
Funding rates are not theory. They are a constant transfer of value between longs and shorts to keep perp prices anchored near spot. When you are long during positive funding, you pay to hold your position. When you are short during negative funding, you pay instead. Multiply that across leverage and time, and your outcome changes dramatically.
If you hold positions for longer intraday swings, or if you let trades drift into the next session, funding can become a silent companion to every decision you make.
In strong bull phases, funding often flips positive and stays there. Longs bleed slowly while shorts sometimes collect. In unwind periods or panic moves, the opposite can happen. Shorts pay heavily while longs occasionally earn. Exchanges like Binance, OKX, and Bybit all reflect these shifts in slightly different ways, but the effect is always there.
The biggest trap is that funding does not feel like a trade outcome. It feels like background noise. Something you acknowledge, then forget. But if your strategy relies on dozens or hundreds of trades per month, the cumulative transfer becomes material.
A strategy that earns 2 to 3 percent per month before funding may fall close to break-even after, especially if you lean with the crowded side of the market. And when volatility spikes, funding spikes with it.
Which means:
The moment you stop tracking it, you underestimate reality.
Reduce the Scalper’s Tax From Fees
Next comes the fee layer.
Every entry and every exit is taxed. Most traders default to taker orders because they want certainty. Click the button. Fill the trade. Done. The problem is that taker fees stack up fast. Especially when you scalp or scale in and out.
Maker orders, by contrast, often carry lower fees. Sometimes you even receive a rebate. But that advantage must be balanced against execution risk.
Real trading nuance shows up here.
For example, a round trip of 0.04 percent does not sound like much. But if you use leverage and trade frequently, that small bite becomes enormous. It is even worse if you get partial fills, chase entries, or close earlier than intended to lock in gains.
Scalpers often discover that their raw trade logic works. They are reading the tape well. But the cost structure sits on top like a permanent weight.
You are not just trading price action. You are trading price action minus frictions.

Understanding that distinction may be the single biggest improvement a serious trader can make.
Build Clean Diagnostics From Your Exchange PnL
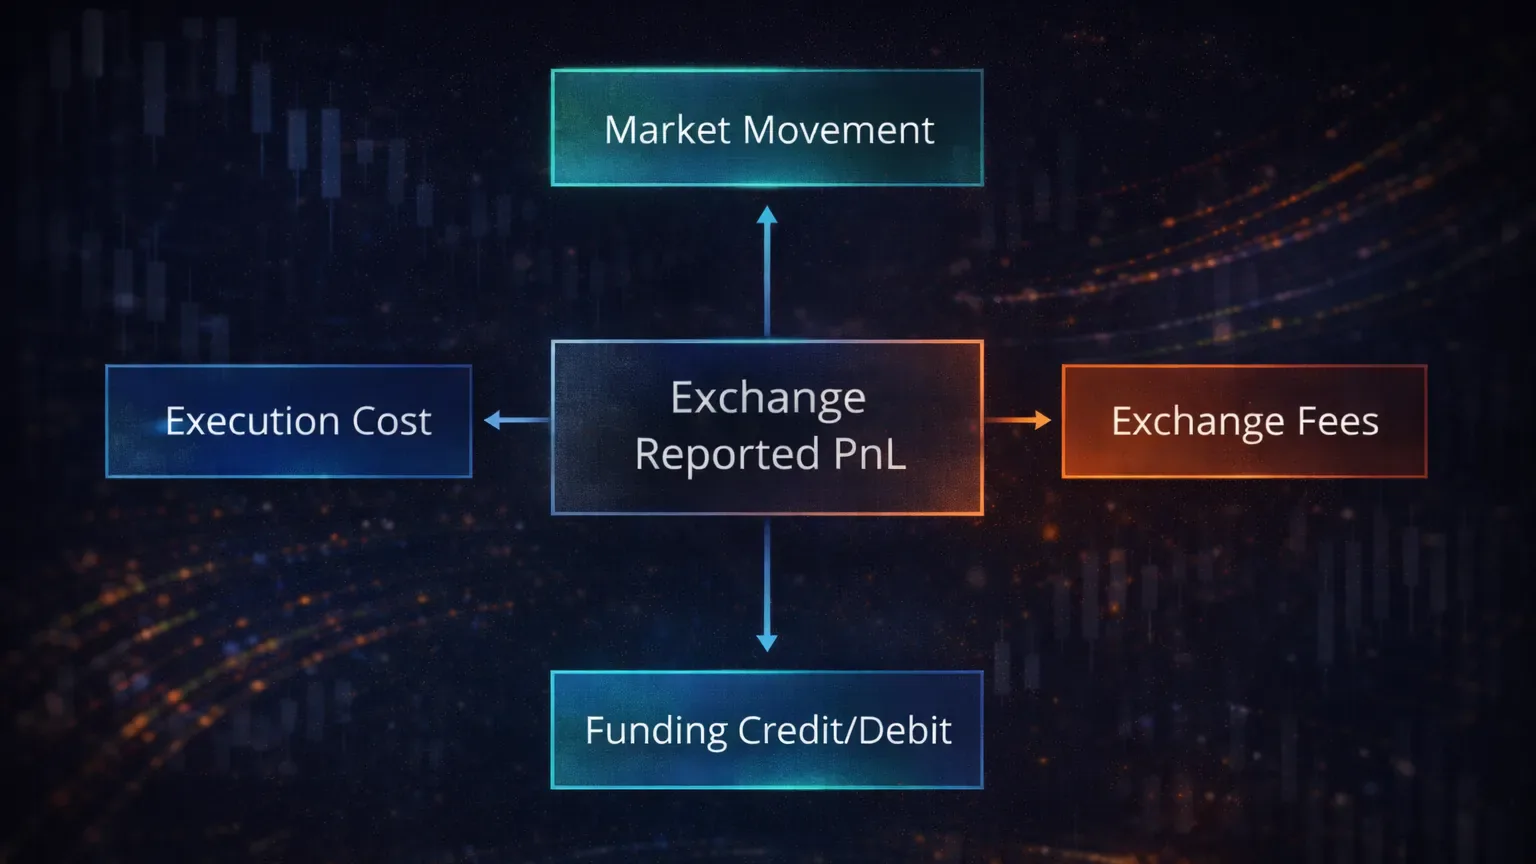
Most exchanges display a single PnL number for each trade. That number silently bundles together:
• Market movement • Funding credit or debit • Fees in and out • Slippage • Execution errors
So when performance slips, you do not know where the damage came from.
Was it your setup? Was it your execution? Was it market structure? Or was it simply the cost of doing business?
When you cannot separate these forces, everything feels random. That increases tilt risk. It also increases the chance that you abandon a good system or scale up a weak one.
Your goal is not just to log trades. Your goal is to see inside your results.
That requires structure.
Turn One Trade Into Four Clear Buckets
A simple way to think about a trade:
Net Result = Strategy Edge minus Execution Cost minus Exchange Fees minus Funding Impact
Each part matters.
Strategy edge is your ability to read the market and structure good trades. Execution cost includes slippage, late fills, and unnecessary churn. Fees are fixed, but their size depends on your style. Funding reflects the broader positioning of the market.
When you break this down in your journal, you learn quickly:
- Some strategies have strong raw edge but poor cost tolerance
- Some are cost efficient but weak in directional conviction
- Some are fragile in high funding environments
- Some degrade heavily when market liquidity thins
You stop guessing and start diagnosing.
Suddenly improvement becomes specific. You know what to fix and why.
Build Cost Visibility Into Your Trading Journal
In practice, this means logging every trade with both gross and net results. Gross PnL reflects the pure market move relative to your entry and exit. Net PnL includes the reality of trading costs.
To keep it simple, track six things per trade: fees per trade, funding credits or debits, position size, holding duration, leverage used, and market regime or context.
Tags then help you group and analyze patterns. Examples include:
“High funding environment” “Aggressive taker entry” “Maker entry only” “Overnight hold” “Low liquidity session”
Your journal becomes a microscope rather than a diary. It reveals whether costs are eating your edge or whether the core logic needs work.
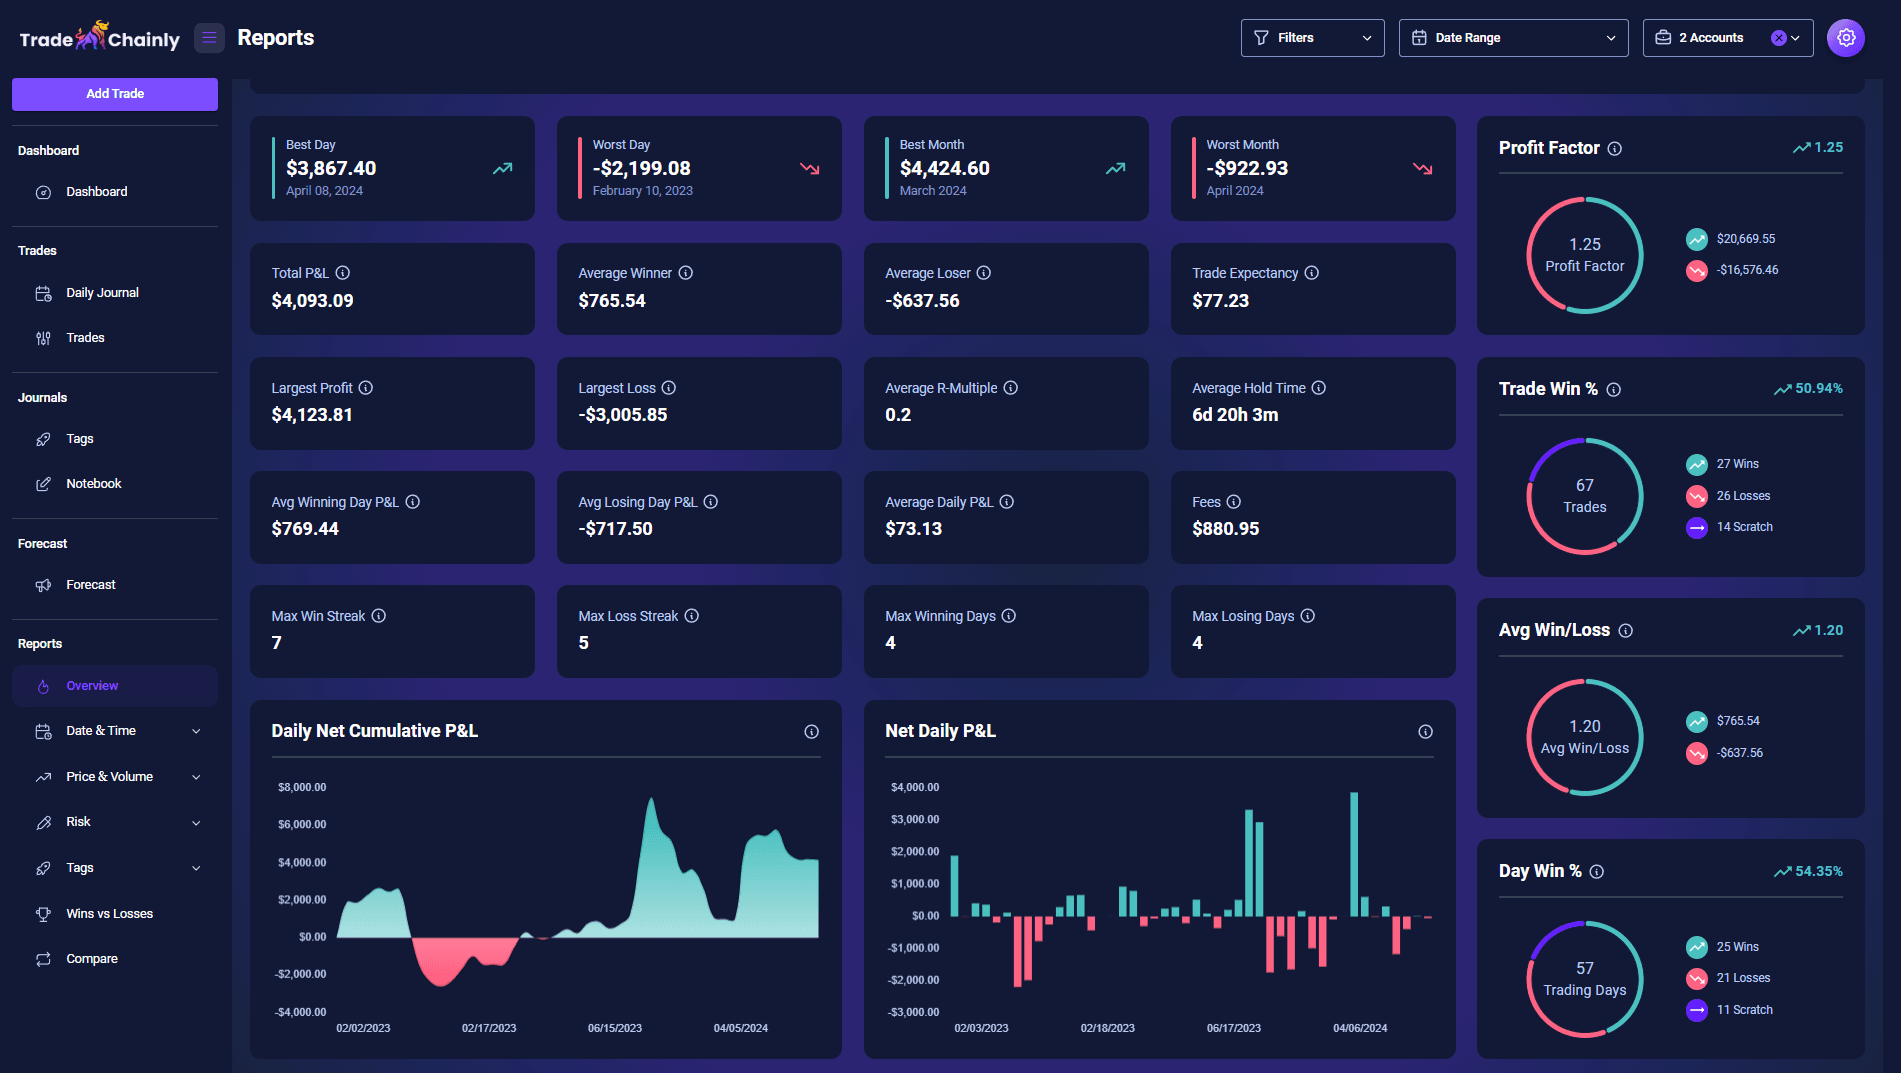
Platforms like TradeChainly help crypto traders automate this process by importing trade data and letting you tag and review fee and funding impacts without spreadsheets. The goal is not complexity. The goal is clarity.
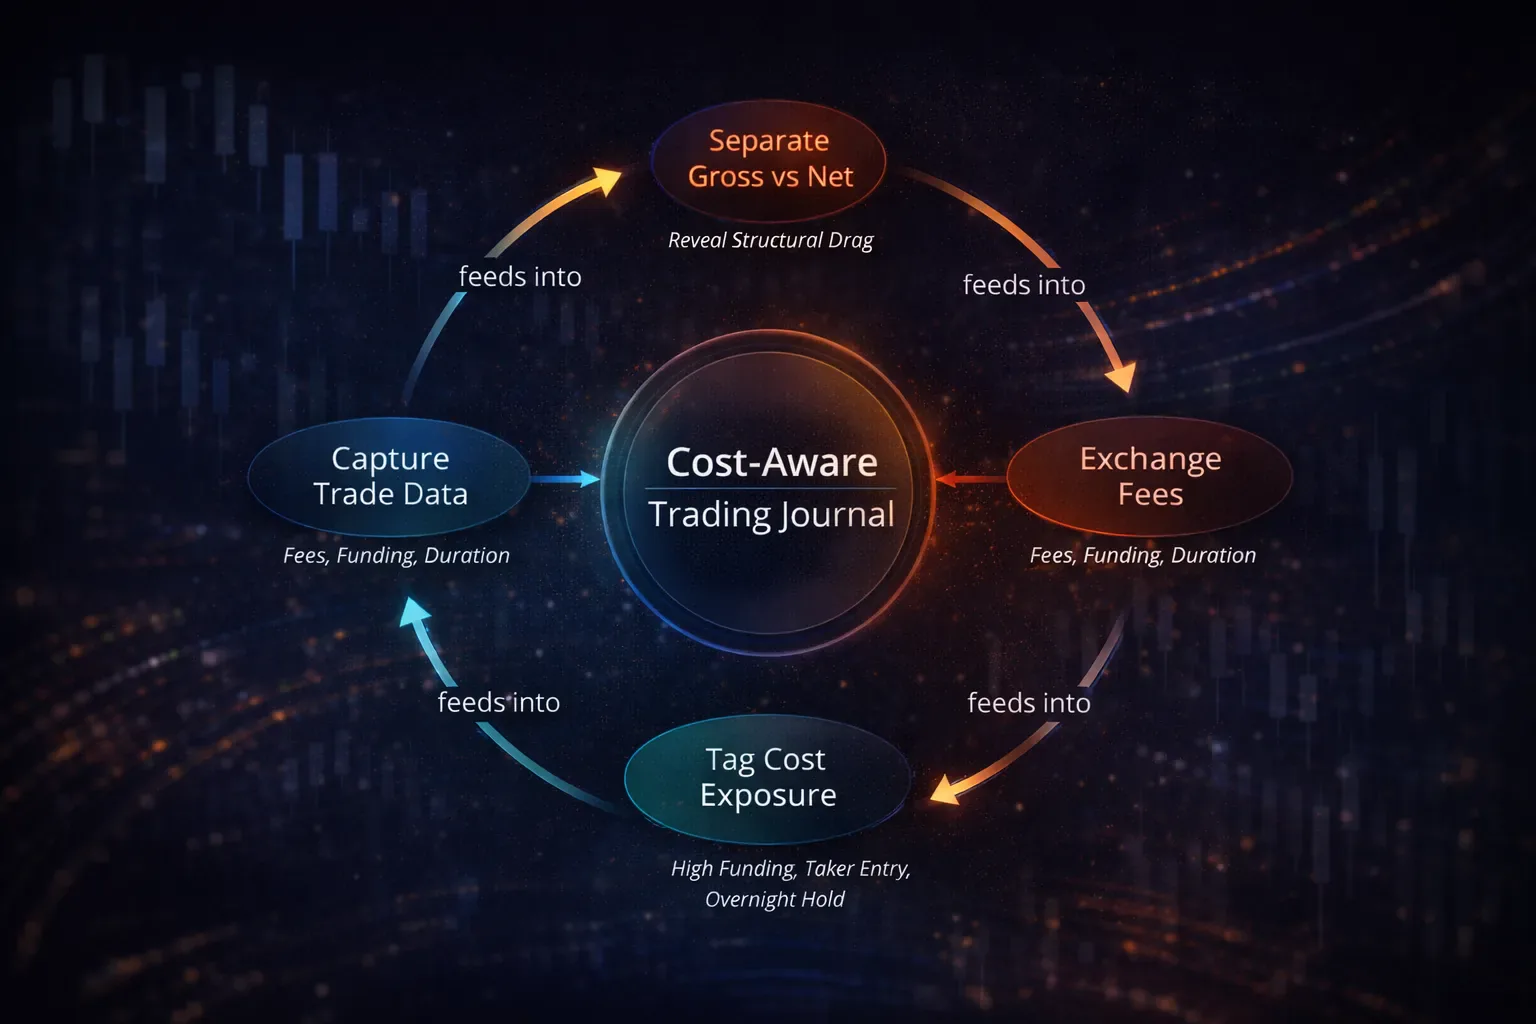
Once you see the separation, you cannot unsee it.
Adapt to Regimes Where Funding and Liquidity Shift
Costs are not constant. They fluctuate with the emotional state of the market.
In strong bull phases, longs often pay heavily. Traders chasing upside pay a premium to stay in position. Shorts sometimes collect, but face directional risk. In panic environments the polarity flips. Shorts become crowded and pay instead. Weekend sessions can thin out liquidity, making execution more expensive even if posted fees stay the same.
If you do not track these shifts, you may think your strategy degrades at random times. In reality, your rule set is clashing with the current cost structure.

Your journal lets you identify which regimes amplify or tax your edge. From there, you adapt instead of forcing the market to fit your expectations.
Turn Insights Into Rules You Can Actually Follow
Awareness is not enough. You convert it into behavior.
Examples of rules traders create after studying fees and funding:
- Avoid holding long positions through multiple funding cycles when funding is strongly positive
- Size smaller when funding spikes significantly
- Prefer maker entries when order flow allows it
- Reduce trade frequency in low conviction chop to avoid fee bleed
- Only hold through funding if conviction and structure justify the cost
These rules are then reviewed alongside tags and session notes. Over time this creates a feedback loop. You no longer rely on memory or emotion. You rely on data.
TradeChainly can help systemize this type of review so that cost awareness becomes part of your normal post-session routine, instead of something you only think about after a losing week.
Catch the Cost-Tracking Mistakes That Keep Repeating
Many traders fall into the same traps:
They only track net PnL and never examine gross edge. They assume funding “balances out.” They underestimate how leverage multiplies fees. They adjust strategy before checking structural drag. They respond emotionally instead of analytically.
The solution is boring but powerful.
Log. Tag. Review. Refine.
Over time, small adjustments become significant advantages.
Close the Gap Between “Good Trades” and Net Profit
Your goal as a crypto day trader is not just to predict price. Your goal is to produce repeatable positive results after all costs are applied.
Funding and fees are not side notes. They are core variables. When you ignore them, your trading feels random. When you track them clearly, you finally see what is working and what is not.
A good journal turns the lights on.
Platforms like TradeChainly are built around this reality for crypto traders. Automated imports, tagging, and reporting make it easier to see your edge and protect it from structural drag. The more serious you become about your data, the more calm and confident your trading process becomes.
Your strategy may already work. Now measure it honestly.