Why Filters Matter in Crypto Trading
Crypto trading moves fast. Markets are open 24/7, price action changes in seconds, and leverage can amplify both your wins and your mistakes. After a few weeks of trading on Binance, Bybit, OKX, or KuCoin, you are left with hundreds of trades, multiple setups, different account sizes, funding payments, and emotional decisions that crept in when volatility spiked.
Some of those trades helped your account. Many probably did not. The real problem is this:
You do not actually know which ones made the difference.
Most traders rely on gut feel. You might think your breakout setup is profitable. You might believe you lose most when you overtrade chop. You might blame a symbol like BTCUSDT or SOLUSDT for your losses. The problem is that memory is biased. We remember the dramatic wins. We remember the painful losses. We rarely remember the full picture.
That is where trading journal filters matter. Filters turn messy trade history into clear, structured insight. Instead of guessing, you isolate specific patterns in seconds. You can look only at your scalps. Or only at revenge trades. Or only at losing trades above a certain position size. Or only at trades executed in the New York session. Suddenly the truth becomes visible.
TradeChainly is built for exactly this type of analysis. It is a crypto-only trading journal designed for day traders and scalpers who want data to guide their decisions. Filters are built into TradeChainly so you can drill into your performance without spreadsheets, exports, or manual work. You choose what you want to see. TradeChainly shows it instantly.
This blog will walk you through how TradeChainly filters work, why they matter, and how crypto traders use them to find patterns faster. By the end, you will know exactly how to slice your trading data to uncover insights that actually improve your trading.
What Are Trading Journal Filters?
Before we get into TradeChainly specifically, it helps to clarify what trading journal filters actually are.
A trading journal collects all of your trades in one place. Over time, that becomes hundreds or even thousands of trades. Some are winners. Some are losers. Some happen during high volatility. Others happen during quiet periods. Without any way to separate or group them, all of those trades sit together in one big list. It is almost impossible to learn anything useful from that.
Filters change that completely.
A trading journal filter lets you show only the trades that match specific criteria. For example, you might only want to see:
- Only long trades
- Only trades tagged as “breakout”
- Only losing trades
- Only SOLUSDT trades
- Only trades from your Bybit account
- Only trades where you rated the execution low
- Only trades from last week
- Only trades taken during a bull trend
Instead of scrolling through your entire trade history, you narrow the view down to exactly what you want to analyze.
This is especially important for crypto traders. Markets never close. You may trade multiple pairs like BTCUSDT, ETHUSDT, SOLUSDT, or altcoins on leverage. You may place more trades in one week than a stock trader places in two months. Over time, patterns become buried under sheer trade volume.
TradeChainly filters are built to handle that reality. They help you drill into your performance across exchanges, accounts, symbols, setups, mistakes, and time periods. You focus only on what matters in that moment. The noise disappears. Patterns become clearer. Your review becomes faster and more intentional.
Where Filters Exist in TradeChainly
TradeChainly is designed so that filters are not an extra feature hidden somewhere in the app. They are part of the core workflow. Anywhere you need to analyze trades, filters are available to help you narrow down the data.
Here are the main areas where you will use filters inside TradeChainly.
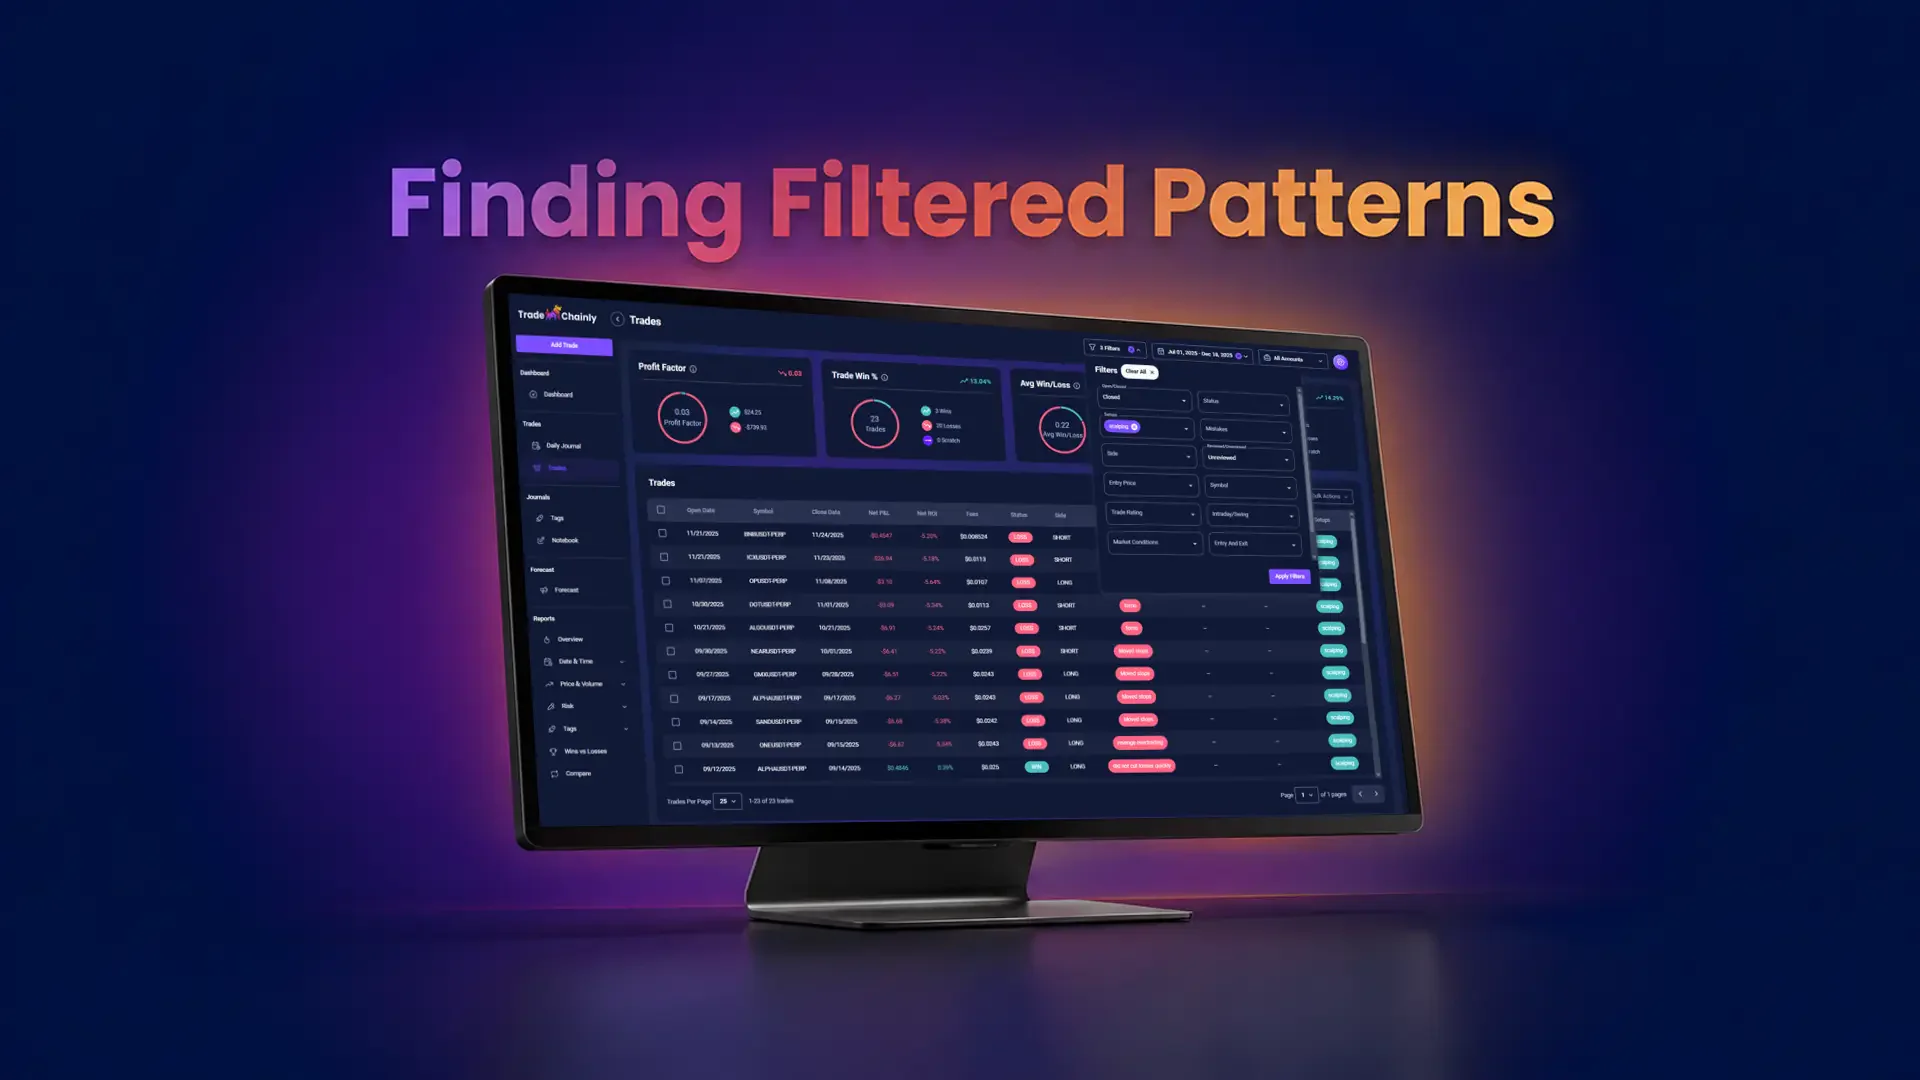
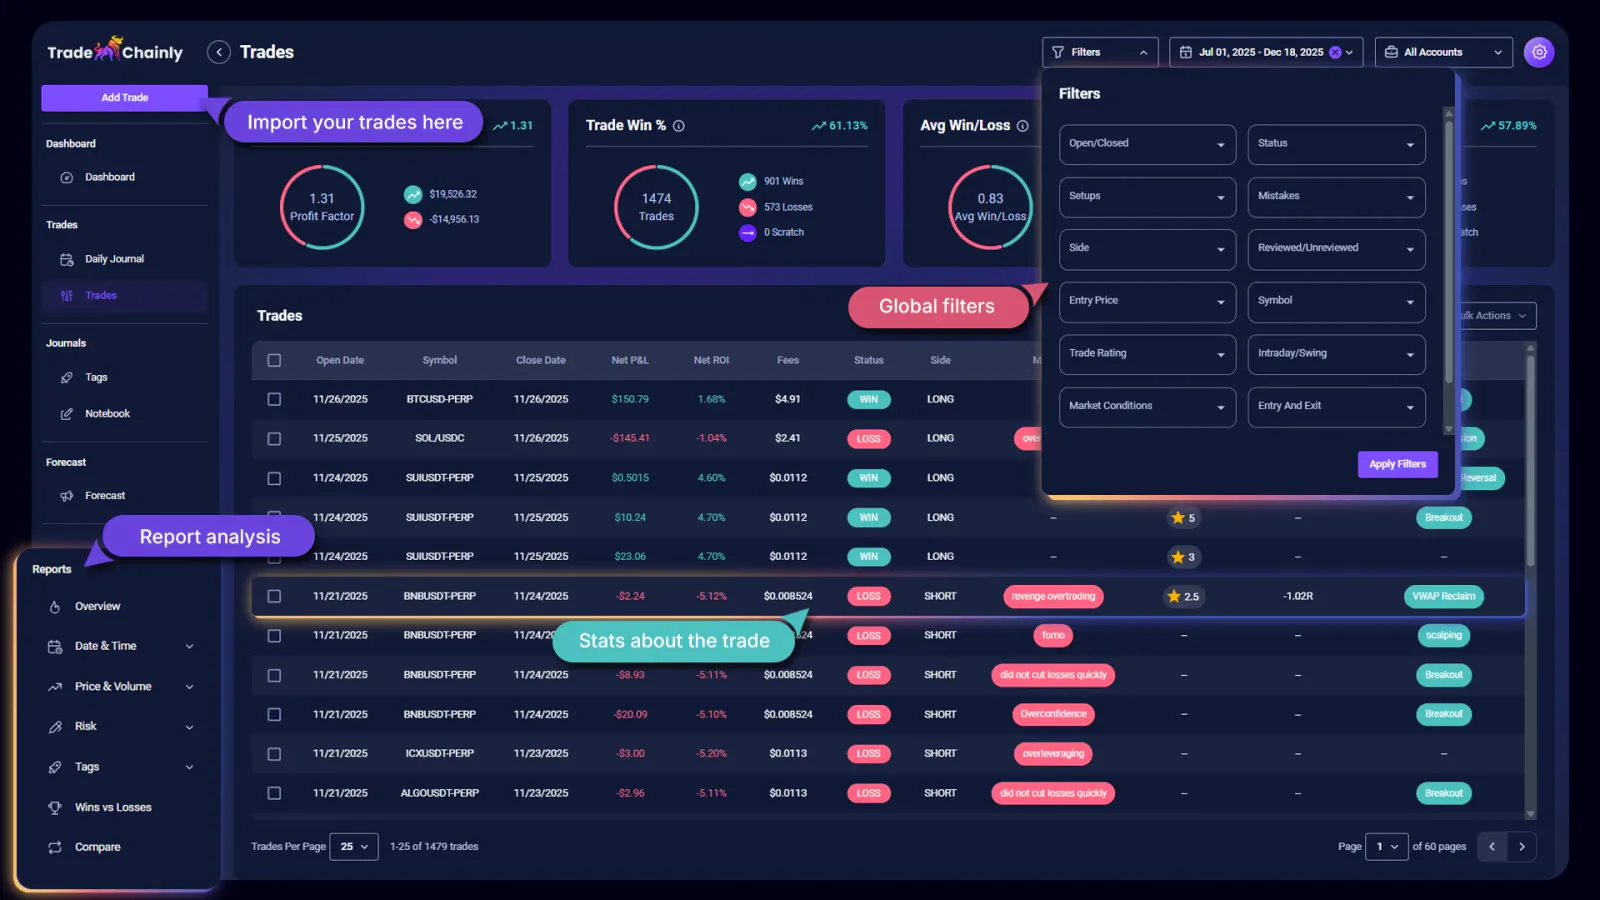
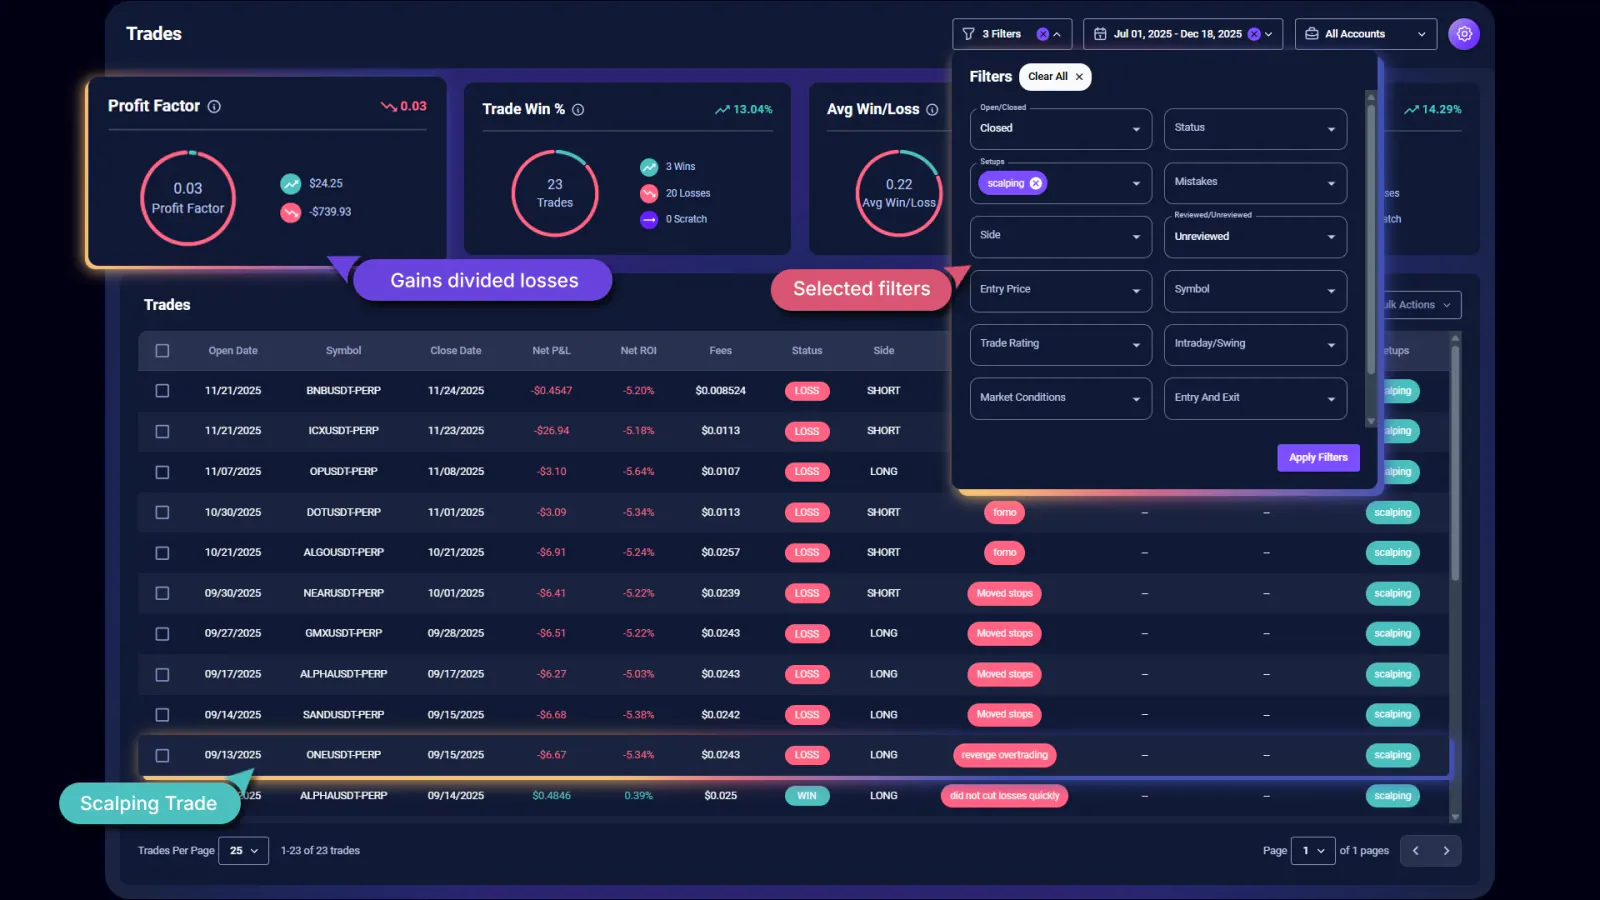
First, the Trades page. This is where you see your full trade history. Every trade that has been synced from Binance, Bybit, Coinbase, Kraken, KuCoin, Crypto.com, or OKX is stored here. Instead of scrolling through a long list, you can instantly filter by setups, mistakes, side, reviewed status, rating, symbol, and more. This is usually where traders start when they want to answer questions like “Which setups are actually profitable?” or “Where do I lose the most money?”
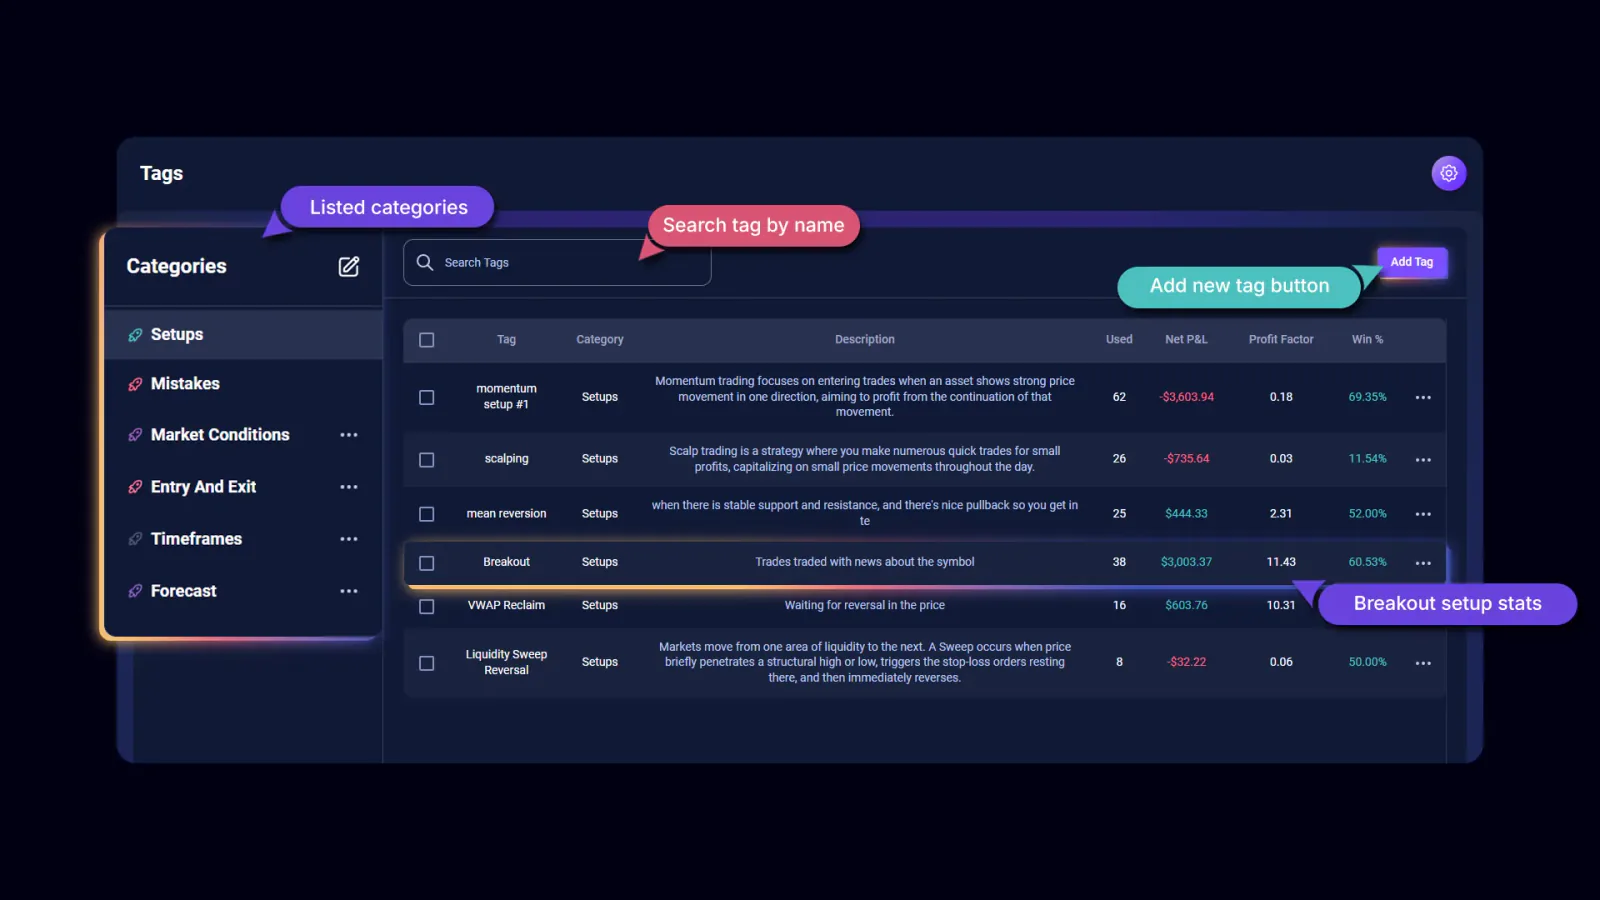
Second, the Tags system. TradeChainly lets you create and assign tags such as breakout, scalping, momentum trading, revenge trading, or FOMO. On the Tags page and Tag Details page, filters help you isolate the performance of each tag. You can see win rate, profit factor, average winner, average loser, and more for any filter combination. This lets you drill down deeper than a simple win vs loss view.
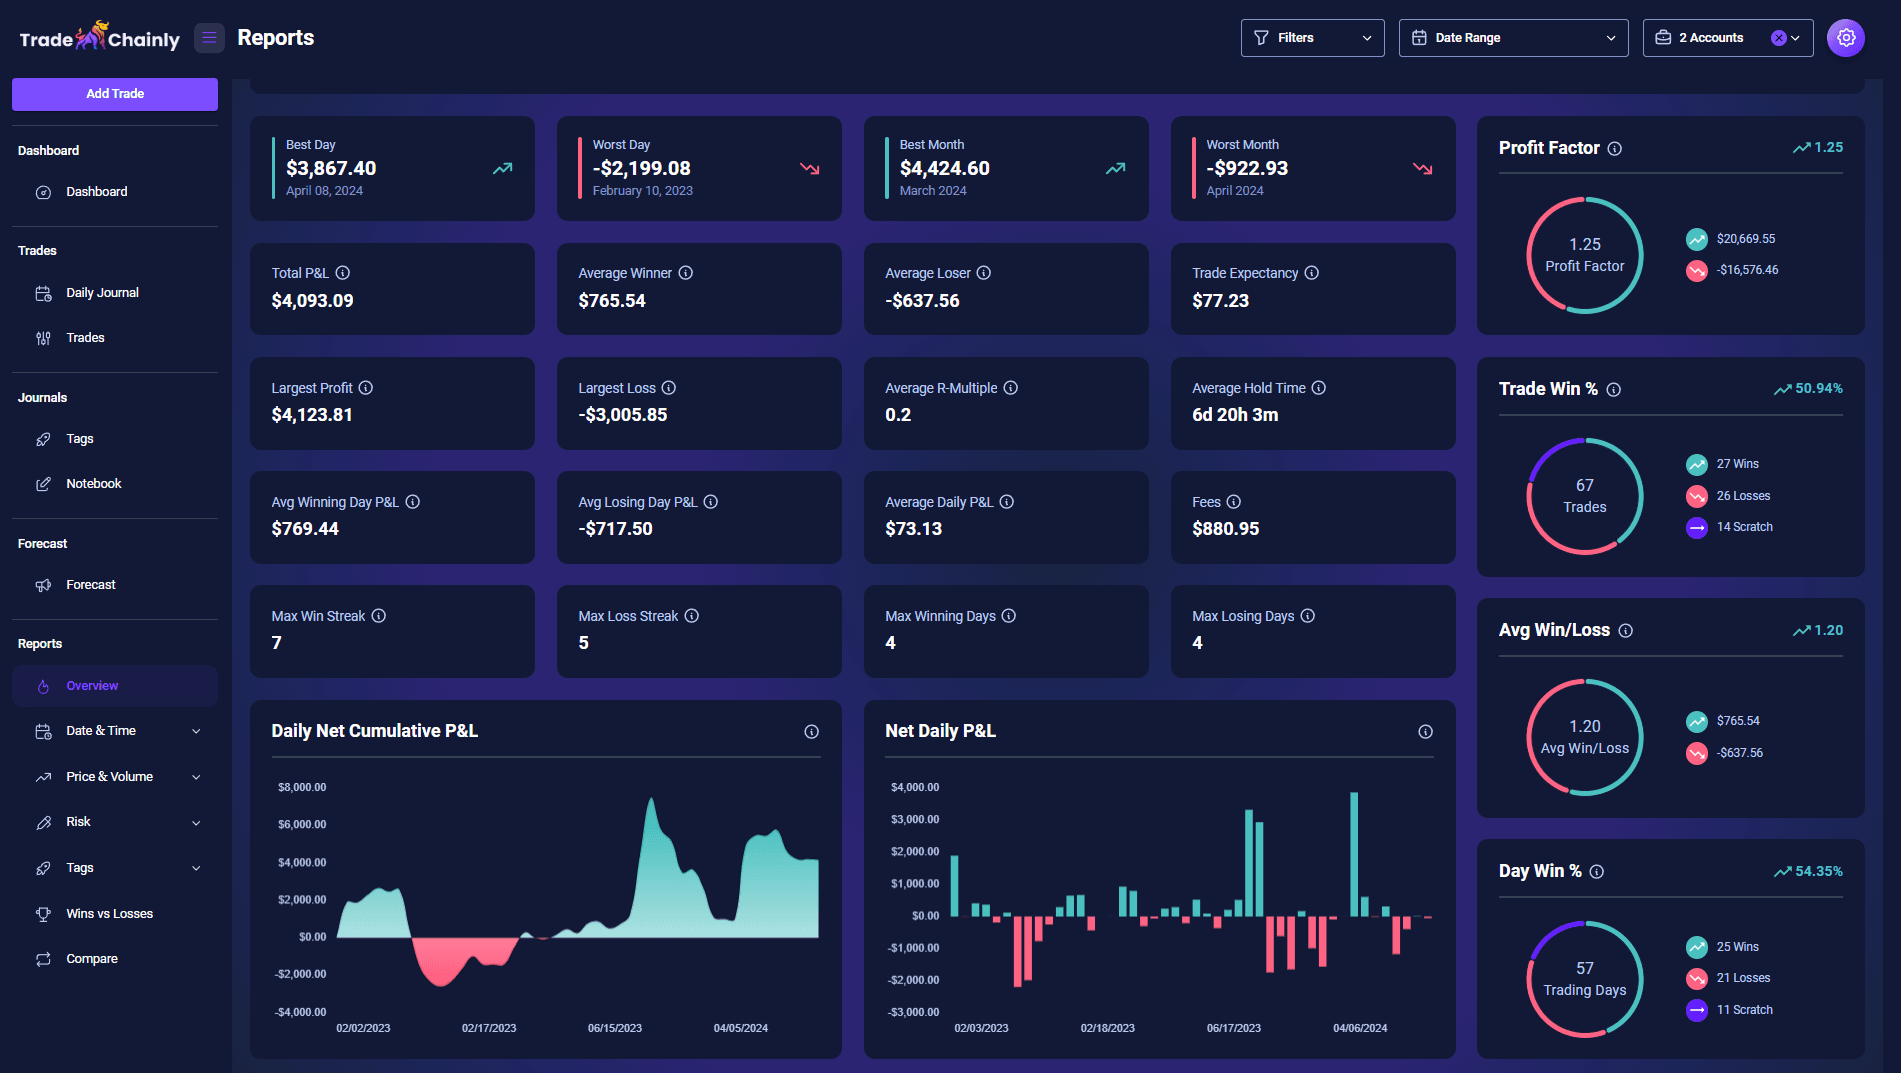
Third, the Reports section. This is where TradeChainly becomes a true analytics platform rather than just a journal. Reports like the Hourly Report, Entry Price Report, Symbol Report, Volume Report, and Tags Report all respond to filters. When you change filters, the entire report recalculates automatically so you can study only the slice of data you care about. For example, you might want to see performance only for trades tagged as “scalping” or only for BTCUSDT shorts.
Fourth, Global Filters. These sit above everything and let you apply broad criteria across the app. You can quickly isolate trades by status, reviewed vs unreviewed, symbol, setups, mistakes, side, rating, and more. Date Range and Accounts work the same way. If you want to see performance from only one connected exchange account, you can. If you only want the last 30 days, you can.
In short, filters live everywhere that analysis happens. You do not need to export your data to a spreadsheet or pay for custom dashboards. TradeChainly centralizes everything and lets you break down performance instantly.
Core Filters Explained
Now that you know where filters appear inside TradeChainly, let’s break down the core filters you will actually use on a daily basis. Each one helps you answer different questions about your trading. When combined, they become incredibly powerful.
Let’s walk through the main ones step by step.
Trade Status and Review Filters
Every trader has two very different workflows. Placing trades. Reviewing trades. TradeChainly helps you separate those workflows with filters for trade status and review status.
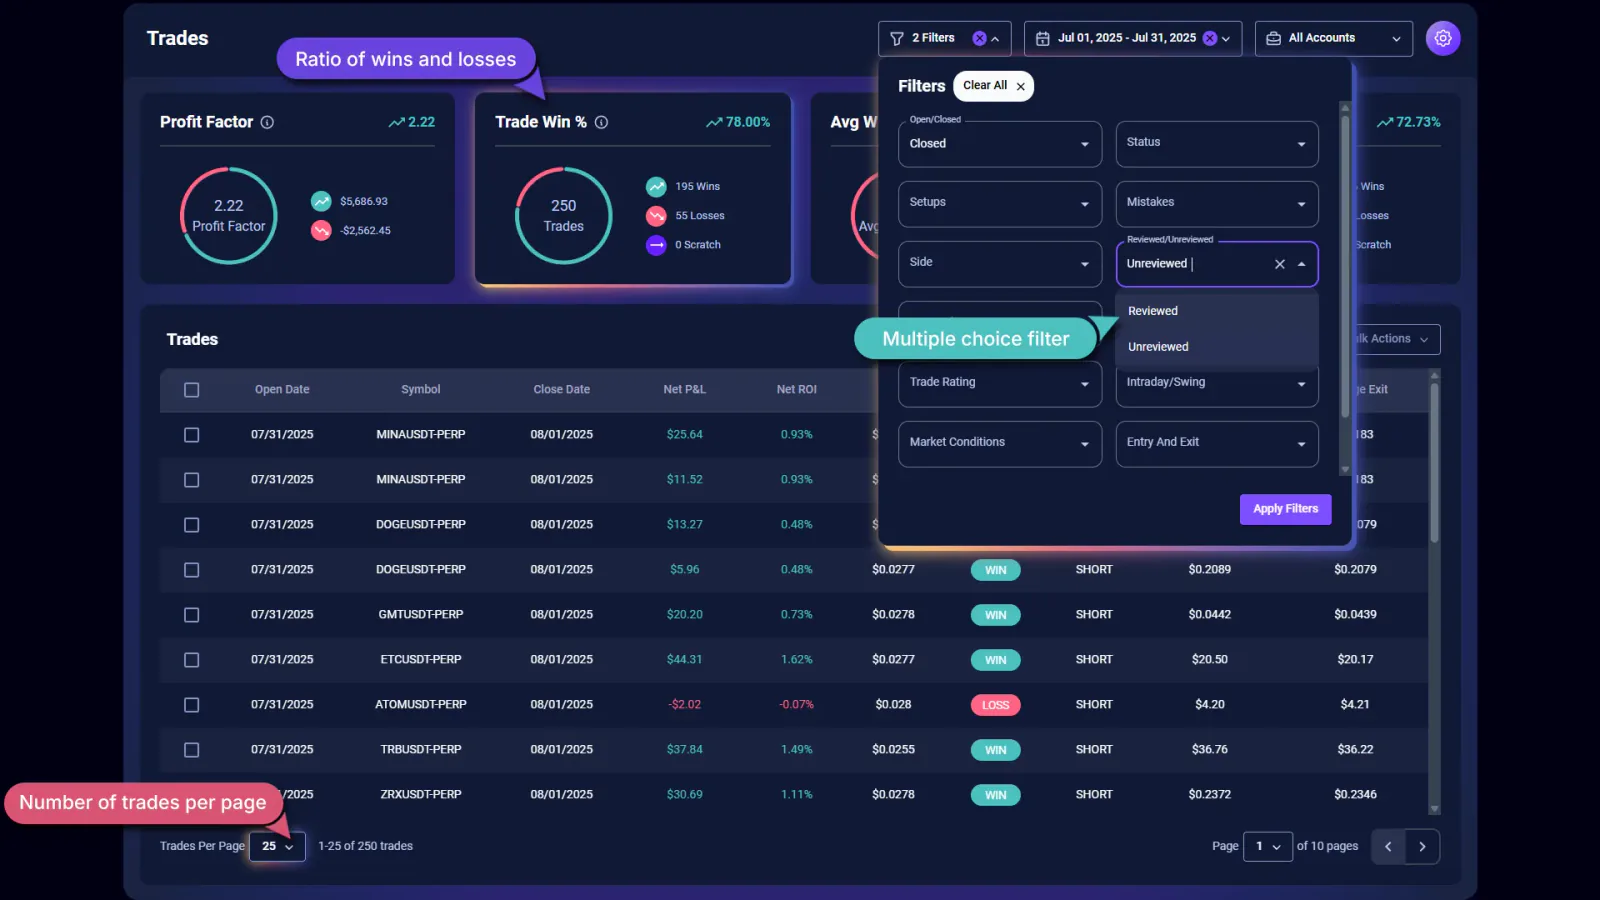
You can filter by open or closed trades. This is useful if you scalp futures and occasionally hold partial positions. You might want to see only completed trades so your performance metrics are clean and final. Or you may want to monitor open risk separately.
You can also filter by reviewed or unreviewed trades. Many traders build a habit where every trade must be reviewed before the week ends. With this filter, you can instantly isolate only unreviewed trades and go through them one by one. No guesswork. No missing trades. Your journaling routine becomes structured instead of random.
Tag Filters
Tags are one of the most powerful parts of TradeChainly. You can group trades by setups, mistakes, emotions, or any custom category you create. For example:
- Breakout trading
- Scalping
- Momentum continuation
- Swing reversal
- FOMO
- Overleveraging
- Revenge trading
Once tags are applied, filters let you analyze each group separately.
You can:
- See which setups make the most money
- Identify the mistakes that cost you the most
- Spot emotional trading patterns
- Find edge vs noise
This is where many traders have “aha” moments. A setup you love might actually be your worst performer. A mistake you dismiss as occasional might show up dozens of times. Filters remove any illusion. The data tells the truth.
Trade and Market-Based Filters
TradeChainly also gives you several filters that relate directly to how and where you trade.
You can filter by side. Long or short. This helps you quickly see whether your bias impacts performance. Many crypto traders perform much better in trending markets and struggle when fading moves. This filter reveals that clearly.
You can filter by symbol. BTCUSDT might behave differently for you than SOLUSDT or ETHUSDT. Meme coins might show high volatility but inconsistent results. Stablecoins or majors may offer slower but steadier setups. Instead of mixing everything together, you isolate performance pair by pair.
You can filter by trade rating. If you rate execution quality inside TradeChainly, you can study how discipline and edge alignment impact results. For example, you may find that your A-grade setups drastically outperform average or rushed trades.
You can also filter based on whether trades are intraday or swing style. This is powerful if you experiment with holding duration. Some traders discover that their intraday performance outperforms longer holds. Others learn the opposite.
Date and Account Filters
Crypto traders often manage multiple accounts or exchanges. TradeChainly is built for that. Each account is tracked separately, but filters let you isolate or combine them however you prefer.
Want to only see Bybit futures trades? Done.
Want to analyze Coinbase spot trades separately? Also possible.
Want to merge everything except one test account? Easy.
Date range filters work the same way. You can zoom into:
- Today
- This week
- Last month
- A custom period
- A bull run stretch
- A losing streak window
This turns your journal into a real analysis lab. You are no longer stuck looking at lifetime stats that hide the story. You can study any time slice that matters.
When you combine all of these filters together, TradeChainly becomes much more than a place where your trades are stored. It becomes a decision-support system built specifically for crypto traders.
How Filters Help You Find Patterns Faster
So far we have talked about what filters are and how they work inside TradeChainly. But the real value comes from how you actually use them in day-to-day trading review. Filters are not about creating pretty charts. They are about finding real, repeatable patterns that impact your P&L.
Let’s look at some practical examples.
Example 1: Identifying Losing Setups
Many traders think they know which setups are profitable. In reality, the data often tells a different story. With TradeChainly, you can filter trades by setup tag such as breakout, momentum continuation, or swing reversal. Once filtered, you instantly see metrics like net P&L, win rate, average winner, average loser, and profit factor.
If one setup shows consistent losses over 50 or 100 trades, you now have objective evidence. You may decide to stop trading it entirely, or you may refine your criteria. Either way, you are no longer guessing. You are improving based on data.
Example 2: Isolating Emotional Mistakes
Crypto volatility often triggers emotional responses. You might chase pumps. You might overleverage. You might refuse to cut losses. By tagging these mistakes, you can later filter trades that include FOMO, revenge trading, or overtrading.
This is usually an eye-opener. You may discover that a small percentage of emotionally driven trades account for a huge portion of your losses. That realization is often the turning point in a trader’s journey. TradeChainly makes it obvious.
Example 3: Performance by Symbol or Session
BTCUSDT might be your comfort zone. But maybe SOLUSDT is quietly producing better returns. Or perhaps your results collapse whenever volatility spikes in certain pairs.
By filtering trades based on symbol, you can compare performance instantly. You can do something similar with time-based reports like the Hourly Report to see whether you perform better during certain market sessions or times of day.
Instead of blaming the market, you uncover where you actually thrive.
Example 4: Filtering by Position Size or Risk Level
Some traders perform well when size is small but panic when position size increases. With TradeChainly filters, you can isolate trades above a certain volume or risk allocation. If performance drops sharply with larger size, you know the issue is psychological rather than technical.
That level of clarity helps you build proper position scaling plans.
Example 5: Reviewing Only What Matters
Trade review often feels overwhelming. Hundreds of trades. Endless charts. No clear starting point. Filters fix that problem.
You might choose to only review:
- Losing trades
- Unreviewed trades
- Trades below your rating standard
- Trades associated with one tag
This creates a structured review routine instead of random scrolling. You get through analysis faster and with more focus.
In short, filters inside TradeChainly give you speed and clarity. You do not waste time digging through noise. You go straight to the patterns that matter. Over time, this becomes a major competitive advantage for crypto day traders.
Combining Filters Like a Pro
Once you are comfortable using filters individually inside TradeChainly, the next step is to start combining them. This is where the real power shows up. Instead of answering simple questions like “How do my longs perform?”, you begin answering much deeper questions that reveal the true behavior of your trading.
Here are some examples of how advanced traders combine filters inside TradeChainly.
Example 1: Setup plus Symbol
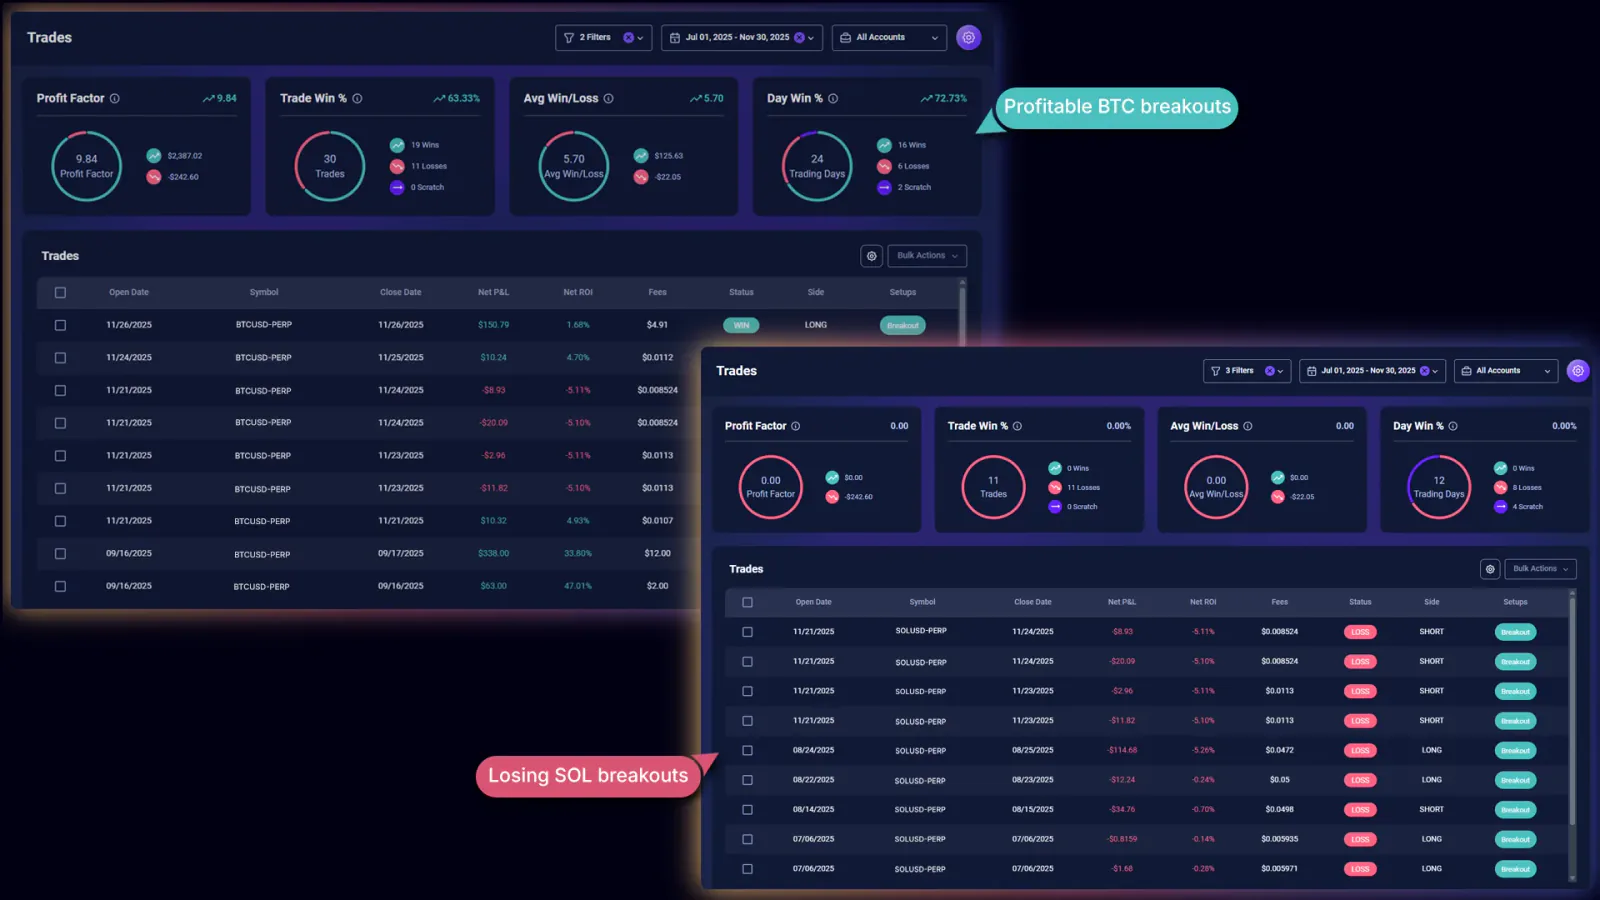
Maybe you trade the same setup across multiple pairs. For example, you might run a breakout strategy on BTCUSDT, ETHUSDT, and SOLUSDT. Instead of looking at all breakouts as one group, you can filter by both setup and symbol at the same time.
You might discover that BTCUSDT breakouts perform well, but SOLUSDT breakouts are inconsistent and choppy for you. That insight lets you either stop trading that pair or change your approach specifically for SOLUSDT. Same setup, different behavior. Filters make that visible.
Example 2: Mistake plus Leverage Behavior
If you tag trades with mistakes like overleveraging or revenge trading, you can study how those mistakes combine with market conditions. Maybe you only revenge trade after a losing short. Or maybe overleveraging shows up most often on altcoin pairs during periods of high volatility.
By stacking filters like mistake + side + symbol, you get a clearer psychological profile of your trading behavior.
Example 3: Timeframe plus Performance Patterns
Reports inside TradeChainly such as the Hourly Report let you filter trades by specific conditions and then study when performance improves or declines. You may find that trades taken during early London session perform better than late New York session. Or that your execution quality drops during periods of low liquidity.
This helps you match your trading activity to the times when you perform best, rather than trying to trade every waking hour.
Example 4: Account-Based Comparison
Many crypto traders run multiple exchange accounts. Maybe you scalp futures on Bybit while swing trading spot positions on Coinbase. With TradeChainly, you can isolate accounts to study performance separately, or you can compare them over the same timeframe.
If one account consistently outperforms the other, that tells you something important about your strategy alignment.
When you begin chaining filters together this way, TradeChainly stops feeling like a passive journal. It becomes an active research tool. You are not just tracking what happened. You are learning how you behave, where your edge exists, and where capital is best allocated.
This level of clarity is what most traders are missing. TradeChainly gives you the infrastructure to build it.
Using Filters Across Reports
Filters inside TradeChainly are not limited to the Trades page. They also connect directly with the Reports section, which is where deeper analysis happens. This is where you stop looking at individual trades and start looking at behavior trends across time, price, volume, and symbols.
When you apply filters before opening a report, the entire dataset inside that report adjusts instantly. This means you are never looking at random or unrelated trades. You are always studying a specific slice of your trading behavior.
For example, imagine you want to analyze only your scalping trades. You apply the setup filter, then open the Hourly Report. Now every chart and table inside that report is built from only your scalping trades. You will see which hours of the day are most profitable for that strategy. You will also see where your performance drops.
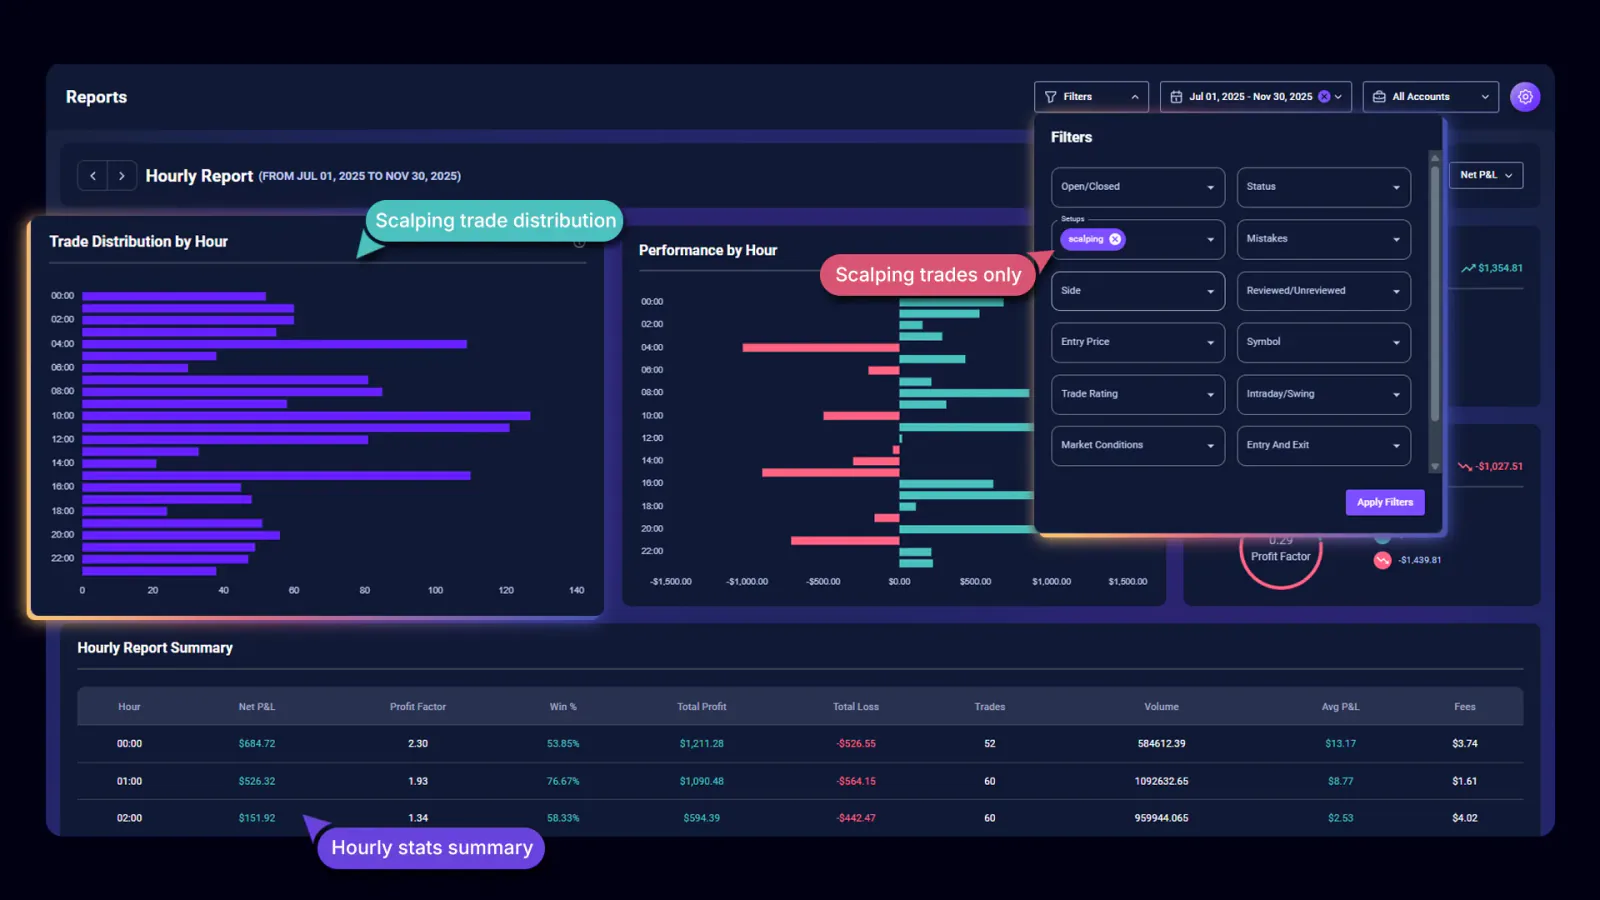
The same works for the Symbol Report. If you want to understand how you perform on BTCUSDT vs ETHUSDT vs SOLUSDT, you can apply additional filters like side, mistake, or reviewed status. TradeChainly rebuilds the symbol-level stats around only those filtered trades. This helps you identify which pairs actually align with your style.
Another useful example is the Entry Price Report. This shows where your trade entries cluster across price levels. When filters are applied, you can study very specific behavior such as how you enter during high-volatility breakouts compared to quiet consolidation periods. This level of detail is difficult to achieve without a proper trading journal.
The Compare Report is also extremely powerful when used with filters. You can split trades into two distinct groups and study their performance side by side. For example, one group could be reviewed trades and the other could be unreviewed trades. Or one group could be tagged with momentum continuation and the other with breakout trading. Filters ensure each group is clean and relevant.
All of this creates a workflow where filters and reports work together instead of existing as separate tools. You filter first. Then you run the report. The result is targeted insight rather than generic statistics.
When you repeat this review process over weeks and months, you begin to see strong recurring patterns. TradeChainly helps you turn those patterns into decisions.
Best Practices for Crypto Traders
Filters are powerful, but like any trading tool, they work best when you use them with intention. Many traders either overcomplicate analysis or barely review at all. TradeChainly gives you the structure. Your job is to build the right habits around it.
Here are some best practices that help crypto traders get the most value from filters.
First, review consistently. Crypto markets trade nonstop, which makes it easy to keep entering positions without ever pausing to reflect. Set aside time each day or week to review your filtered trades. For example, you might review losing trades daily and setup performance weekly. Consistency matters more than marathon review sessions.
Second, avoid overfitting. Filters let you zoom in deeply, but if you slice the data into tiny segments, results can become misleading. Ten trades is not enough to prove or disprove an edge. Look for patterns that repeat across dozens of trades, not random clusters.
Third, focus on repeatable behavior. The goal is not to analyze every single detail. The goal is to find the things you do often enough that they move your P&L. That usually means specific setups, risk behavior, emotions, and market conditions. TradeChainly helps you see that clearly.
Fourth, combine data with self-awareness. Filters tell you what happened. They do not tell you why you behaved a certain way. Use your notes, screenshots, and trade ratings to interpret the story behind the numbers. The combination of qualitative review and quantitative filtering is where the real growth happens.
Finally, stay objective during losing periods. Every trader goes through drawdowns. When emotions rise, traders tend to abandon review entirely. This is when filters help the most. They show whether losses come from random variance or specific bad habits creeping back in. That insight keeps you grounded.
The goal is not perfection. The goal is clarity. TradeChainly filters help you build it step by step.
Turn Filtered Data Into Better Trading Decisions
Most traders never truly understand their own performance. They jump from strategy to strategy. They trust gut feel. They react to every market move. Over time, the data exists, but it is locked inside their exchange history with no structure and no meaning.
TradeChainly changes that by making filters a core part of your trading workflow.
Instead of guessing which setups work, you see the numbers. Instead of assuming emotions are “not a big deal,” you can literally measure the cost of revenge trades or FOMO entries. Instead of lumping all trades together, you can isolate performance by symbol, account, session, rating, style, and more.
Filters turn your trading journal from a storage tool into a decision tool.
This is especially important for crypto traders. The market never sleeps. Volume and volatility shift constantly. Leverage amplifies both opportunity and risk. Without clear feedback loops, it becomes nearly impossible to grow consistently. Filters give you that feedback loop in seconds.
TradeChainly is built so this process feels natural. Sync your trades. Tag them. Review them with filters. Study reports. Refine your decisions. Repeat the cycle. Over time, your trading becomes more intentional and less emotional. You begin acting like a data-driven trader rather than a reactive one.
If you are journaling already, filters will help you get more value from every review session. If you are not journaling yet, TradeChainly gives you an edge that spreadsheets and basic trackers simply cannot match.
Your goal is simple: understand what truly works for you in the crypto market. TradeChainly filters help you find those patterns faster.