
When Accuracy Becomes a Liability
High win rates destroy more crypto accounts than low ones.
If you spend enough time in crypto trading circles, you’ll hear people brag about win rate. “I win 70 percent of my trades.” “I only lose one out of four.” On the surface, that sounds like consistency. It sounds like edge. In reality, a high win rate often hides problems that slowly bleed an account over weeks or months.
Crypto day trading is the perfect environment for this trap. You have 24/7 markets, leverage always available, and liquidity that can turn thin without warning. You scalp small gains during clean moves. Then one move runs hard against you on Binance or Bybit, your stop slips, or you hesitate for half a second. That single trade can erase a full week of “high win rate” trading. Sometimes more.
So the problem is not whether you win often. The problem is what happens when you lose.
Two traders can both have a 65 percent win rate. One slowly compounds. The other blows up every few months. The difference usually has nothing to do with entries or indicators. It comes from the relationship between risk per trade and the size of wins and losses. That relationship is what R-multiple exposes.

This article is written for active crypto day traders and scalpers who already know the basics. You place stops. You size positions. You understand leverage, funding, liquidation risk, and how fast a candle can move during a cascade. You want to measure real edge, not just feel “right” about your trading.
By the end, you will understand:
- Why win rate alone is almost meaningless
- Why R-multiple gives a clearer view of performance
- How expectancy ties everything together
- And how this actually shows up in your trading data over time
We are not chasing theory here. We are looking at how real crypto traders survive, improve, and build consistency through numbers that tell the truth.
A Real Trader With a Great Win Rate and a Flat Account
Let’s look at a realistic example.
A futures day trader on Binance has been trading BTC and SOL intraday for about a year. They scalp momentum during the London and New York overlap. Over the past three months, they averaged a 68 percent win rate. On social media, that sounds impressive. In their account balance, it did not feel that way. Equity was flat to slightly down.
Keep that in mind as we go through the mechanics, because the numbers explain exactly why this happens.

R-Multiple Builds a Common Unit for Every Trade
Before we get deeper, let’s align on language. You already know what win rate and risk reward are in general terms. Here we only want to clarify them in the context of R-multiple so we are speaking the same way about results.
Win rate is simple. It is the percentage of trades that close green. If you take 100 trades and 62 of them are winners, your win rate is 62 percent. That number tells you how often your idea works, but it tells you nothing about the size of your wins or losses.
What R-Multiple Measures in Plain Terms
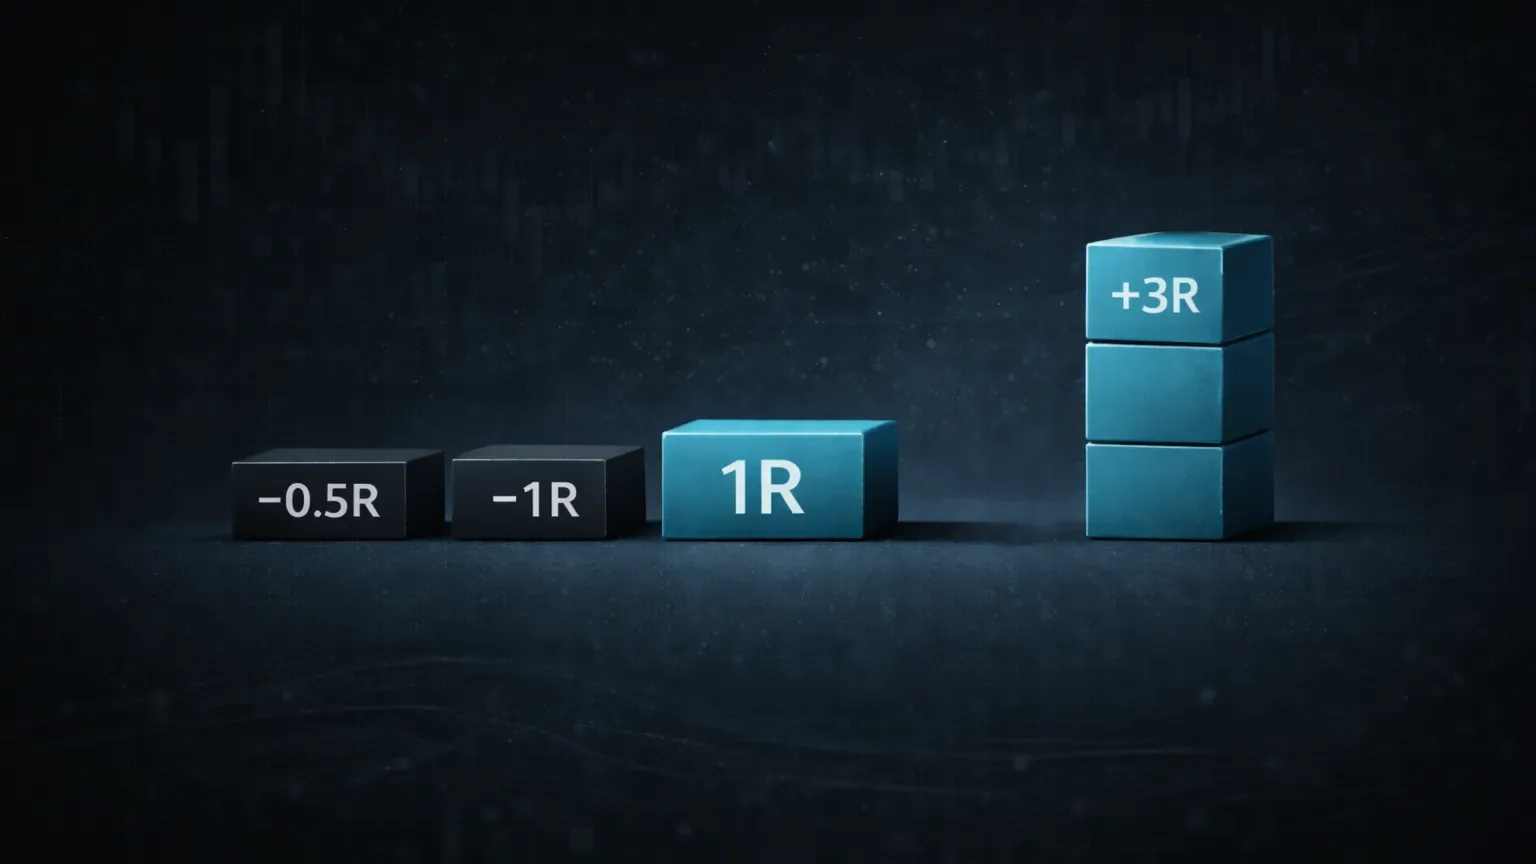
R is your initial risk on a trade. If you risk $100 to your stop, then 1R equals $100. A win of $300 is +3R. A loss that hits your stop is -1R. A partial loss of $50 would be -0.5R.
The point: R normalizes every trade to the same risk unit so you can compare trades fairly, no matter the pair, leverage, or account size.
Why R-Multiple Beats Raw Profit for Analysis
Raw PnL lies. Position size changes. Market volatility changes. Fees and funding impact net outcome. R-multiple strips all of that away. It focuses only on how often you hit your intended reward relative to your intended risk.
Once you convert every trade into R, you can measure true edge across time, sessions, setups, and market types. That is where the real insight begins.
High Win Rate Systems Often Hide Bad Math
Many crypto traders quietly get destroyed by this exact setup. A high win rate feels safe. It feels like control. You stack small winners, lock in profits often, and rarely sit through full stop losses. On paper it looks disciplined. In reality, the math can be working against you the whole time.
The pattern looks like this.
You scalp Bitcoin or ETH perpetuals. Your target is usually small. Maybe +0.4R to +0.8R. You like the feeling of being right. Most trades end green. Then every so often the market snaps. Price wicks through your stop. Or you hesitate. Or you widen the stop because “it will bounce.” That single loser becomes -3R or -4R. With leverage, slippage, and fees layered on top, the damage compounds fast.
Eight wins at +0.5R give you +4R total.
Two losses at -4R each give you -8R total.
Your win rate is 80 percent. Your account is down -4R.
That is the trap.
Crypto makes this worse than traditional markets. Liquidation cascades happen fast. A thin order book on an altcoin can gap straight through your intended exit. Funding payments chip away at small scalps that linger longer than planned. Weekend liquidity can turn a normal pullback into a violent stop run. All of these increase the average size of your losers relative to your winners.
So you keep winning. You keep feeling confident. But your R-distribution is skewed. Small wins, occasional huge losses. The equity curve bleeds sideways or down. If you do not track trades in R, this pattern is almost invisible. You just tell yourself the losses were unlucky. In reality, the structure of your system is negative expectancy, even with a high win rate.
This is why so many traders with “great accuracy” cannot pull money out of the market consistently. The numbers do not care how often you are right. They care about what happens when you are wrong.

R-Multiple Forces the Truth Into the Open
R-multiple is honest. It does not reward ego. It does not care how often you were right. It shows you the relationship between your average win and your average loss in a way that is impossible to hide from.
When you express every trade in R, something interesting happens. All trades become comparable. A small scalp on SOL/USDT and a larger swing on BTCUSDT futures now live in the same unit system. You can finally answer the real question: “When I win, do I win more than I lose when I’m wrong?”
Track These Two Numbers First
Two metrics matter here:
- Average R per winning trade.
- Average R per losing trade.
If your losing trades are consistently around -1R and your winning trades often reach +2R or +3R, you need far fewer winners to remain profitable. Your win rate could drop to 35–40 percent and you would still compound.
On the other hand, if you clip winners early and routinely accept -2R or -3R when you are wrong, your system bleeds even with a strong win rate. Many crypto scalpers fall into this category. They hate giving profit back, so they exit quickly. But when they are wrong, they hold and hope. The R-multiple math eventually catches them.
Let the Distribution Tell You What the Averages Hide
Crypto amplifies asymmetry. Sometimes the market rewards patience with a +5R or +7R move when momentum really opens up. If your strategy allows those big R wins to happen without choking them early, your entire equity curve shifts upward.
This is why the shape of your R-distribution matters as much as the averages.
If your distribution is:
- Many small wins
- Few normal losses
- Occasional giant losses
You probably have a structural problem.
If your distribution is:
- Mix of small wins
- Regular -1R losses
- Occasional large multi-R wins
You likely have positive convexity in your system. That is what R-multiple reveals far more clearly than raw PnL or win rate ever could.
R does not tell you how it felt to hold the trade. It tells you what the trade was actually worth relative to the risk you chose to take. And that truth is what sets the stage for expectancy.

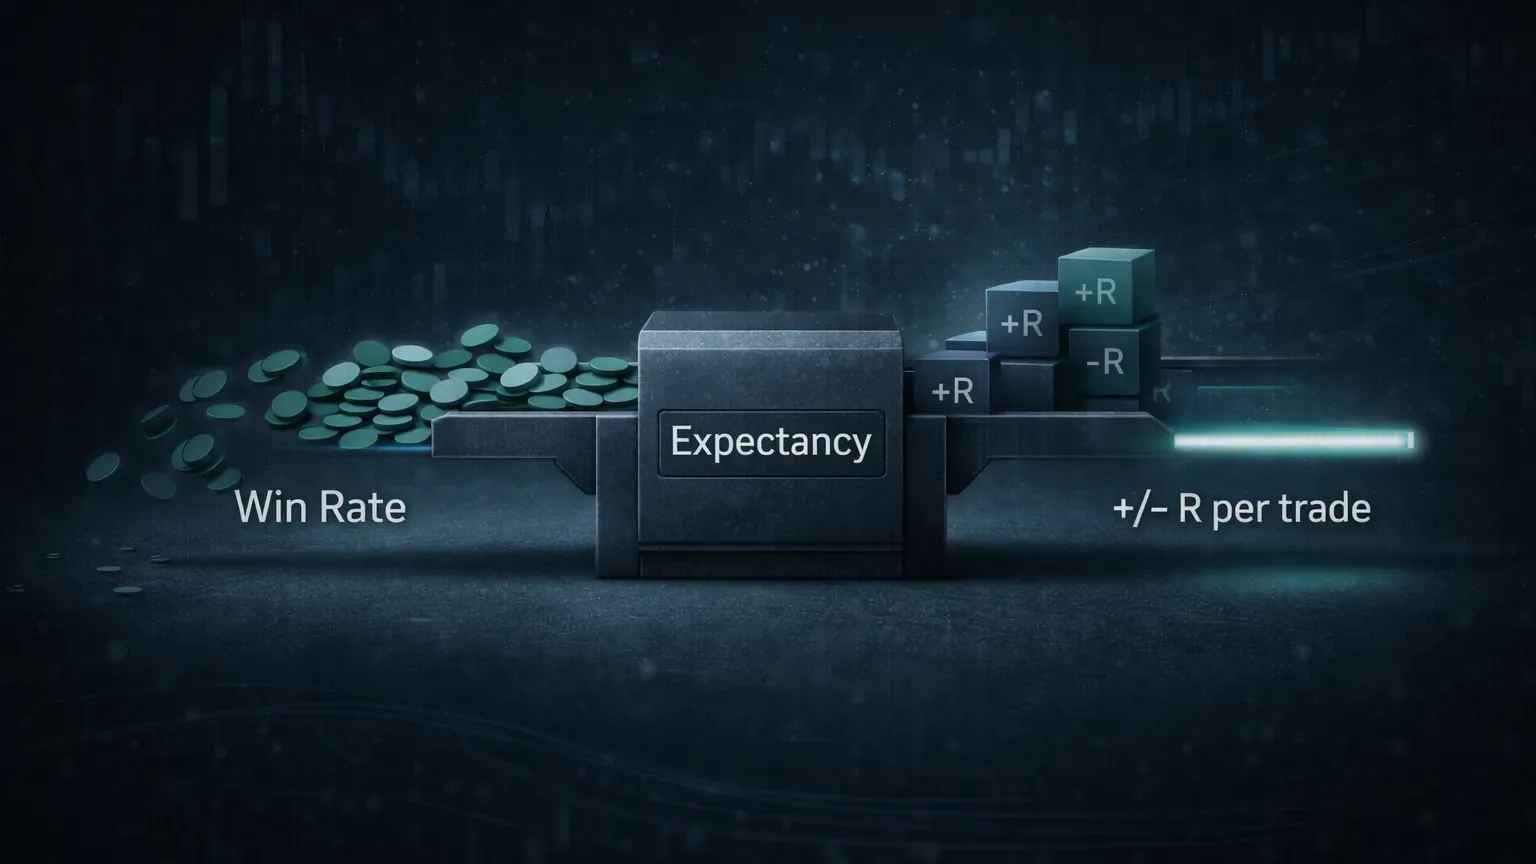
Expectancy Turns Two Metrics Into One Scorecard
Win rate tells you how often you win. R-multiple tells you how much you win or lose relative to risk. Expectancy combines both into one number that describes the average R you make (or lose) per trade.
The formula looks like this:
Expectancy = (Win rate × Average winning R) − (Loss rate × Average losing R)
Loss rate is simply 1 minus win rate.
Think of expectancy as your “profit per trade” measured in R. If your expectancy is +0.5R, then across a large enough sample of trades, you earn half of your risk per trade on average. If you risk $200 per trade, your average expected gain per trade is $100. This does not mean every trade makes $100. It means the math tilts that way over time.
Let’s compare two systems.
Trader A
Win rate: 75 percent
Average win: +0.6R
Average loss: −2R
Expectancy = (0.75 × 0.6R) − (0.25 × 2R)
Expectancy = 0.45R − 0.5R
Expectancy = −0.05R per trade
High win rate. Negative system.
Trader B
Win rate: 42 percent
Average win: +2.4R
Average loss: −1R
Expectancy = (0.42 × 2.4R) − (0.58 × 1R)
Expectancy = 1.008R − 0.58R
Expectancy = +0.428R per trade
Below 50 percent win rate. Strongly positive system.
This is what surprises a lot of traders. You can be wrong more often than you are right and still compound well if your average winning trade is meaningfully larger than your average loss. Crypto volatility helps here. When you catch the right breakout or liquidation unwind, holding a portion of the position can tilt your average R upward.
Expectancy also exposes the fragility of systems that rely purely on accuracy. If your win rate drops even slightly during a choppy period, the entire system flips negative. A trader relying on R-multiple strength is more resilient. They can absorb streaks.
If you’re asking “Which matters more: win rate or R-multiple?” start here. Expectancy is the scorecard. It shows whether your trading decisions, risk parameters, and execution combine into something that produces positive R over time.
The Diagnosis in the Trader’s Data
When they finally dug into their journaling data, the pattern became obvious.
Their average winning trade was only +0.7R. Most trades were closed quickly. The trader hated giving profit back, so they took partials early or closed the entire position at the first sign of hesitation.
Their average losing trade was -2.6R.
Why so large? A few reasons kept repeating in the notes and tags:
- Over-sizing on “high conviction” trades
- Moving stops when price came close
- Revenge trades during liquidation cascades
- Trading during chop outside of normal session windows
Across 400 trades, the numbers were remarkably consistent.
68 percent win rate
Average winning R: +0.7R
Average losing R: −2.6R
Expectancy worked out negative, even though most trades were winners.
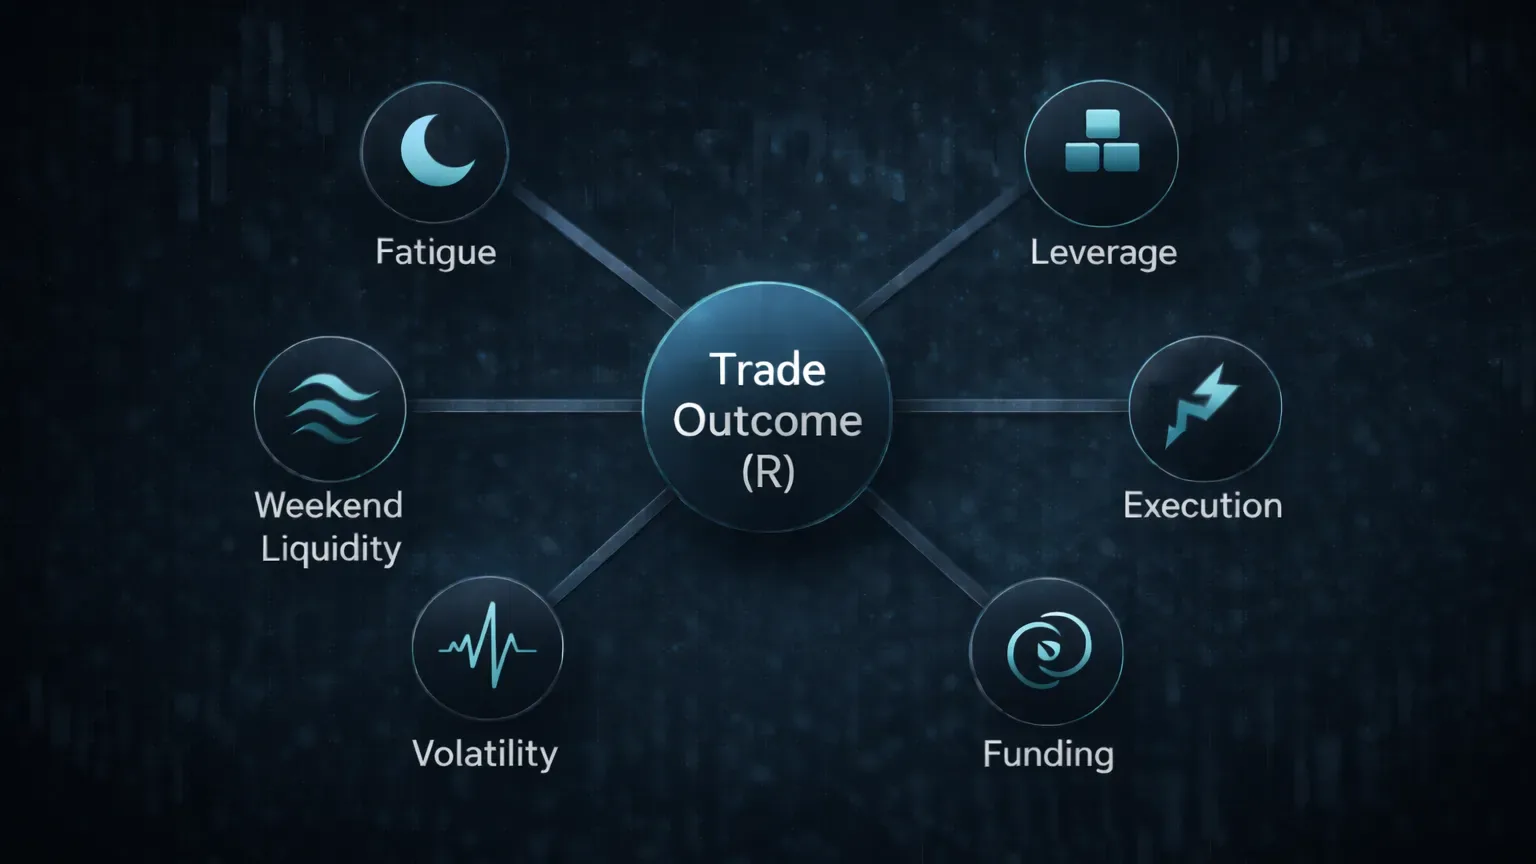
Crypto Microstructure Warps Both Metrics
Crypto is not a normal market. It never closes. Volatility compresses and explodes without warning. Liquidity can vanish when you need it most. All of this affects both your win rate and your average R, which means it also affects expectancy.
A system that looks stable in backtests or in traditional equities can behave very differently here.
Trading fatigue matters more than people admit. Because crypto trades 24/7, many day traders end up forcing entries outside of their best session windows. Late-night trading leads to hesitation, sloppy stop placement, and poor management. Win rate drops. Loss size sometimes increases because decisions are slower when tired. The math shifts against you even if the strategy itself has edge.
Weekend liquidity is another distortion. Order books thin out on many pairs from Friday night through Sunday. Bitcoin and ETH usually hold up better, but altcoin perpetuals can turn violent fast. A normal pullback can suddenly turn into a deep wick that runs straight through your stop. Your losing trades become larger in R terms, even though nothing about your strategy changed.
Leverage adds another layer. A -1R loss on paper can become -1.5R or worse once slippage and fees stack up during a cascade. If you scale into positions aggressively, a fast reversal can hit multiple layers before you flatten. Now your losers are structurally larger than you intended. Expectancy degrades even if your win rate stays stable.
Funding rates matter too. If you hold what was meant to be an intraday trade for longer than planned, negative funding can chip away at the R value of winners. You might book +1R gross but only +0.7R net once fees and funding settle. Over hundreds of trades, that difference is not trivial.
Then there are exchange differences. Binance, Bybit, OKX, Coinbase… each has its own execution quality, liquidation engine, and fee structure. A scalping system that works cleanly on one exchange can feel much noisier on another. That noise shows up in MAE, in average loss size, and eventually in expectancy.
It adds up to one conclusion.
You cannot judge your trading by win rate alone. And even R-multiple needs context. Crypto has enough microstructure quirks that you need to look at your distribution of wins and losses over time, not just one metric in isolation. The more your environment introduces variance, the more disciplined you must be about measuring it.
What They Changed, and What the Numbers Did After
So the trader made changes.
They capped risk per trade at 1R with no exceptions.
They stopped scaling in without structure.
They defined specific session windows and stopped trading outside them.
They accepted that some good trades would continue without them.
The results shifted fast.
Their win rate dropped to around 55 percent. They were stopped out more often because they no longer widened stops. But their average winning trade increased to +1.6R. Losers compressed to roughly −1R.
Expectancy shifted positive.
Now each trade, on average, produced +0.3R to +0.5R across a large sample size. The account finally began to curve upward.
What actually happens for most high win rate traders is this. The goal is not to protect your accuracy. The goal is to protect your R profile so that when the right move happens, it pays you enough to justify all the small cuts. Journaling made that visible. Automated tracking and tagging inside a platform like TradeChainly makes it much easier to see these distributions without sinking hours into spreadsheets.
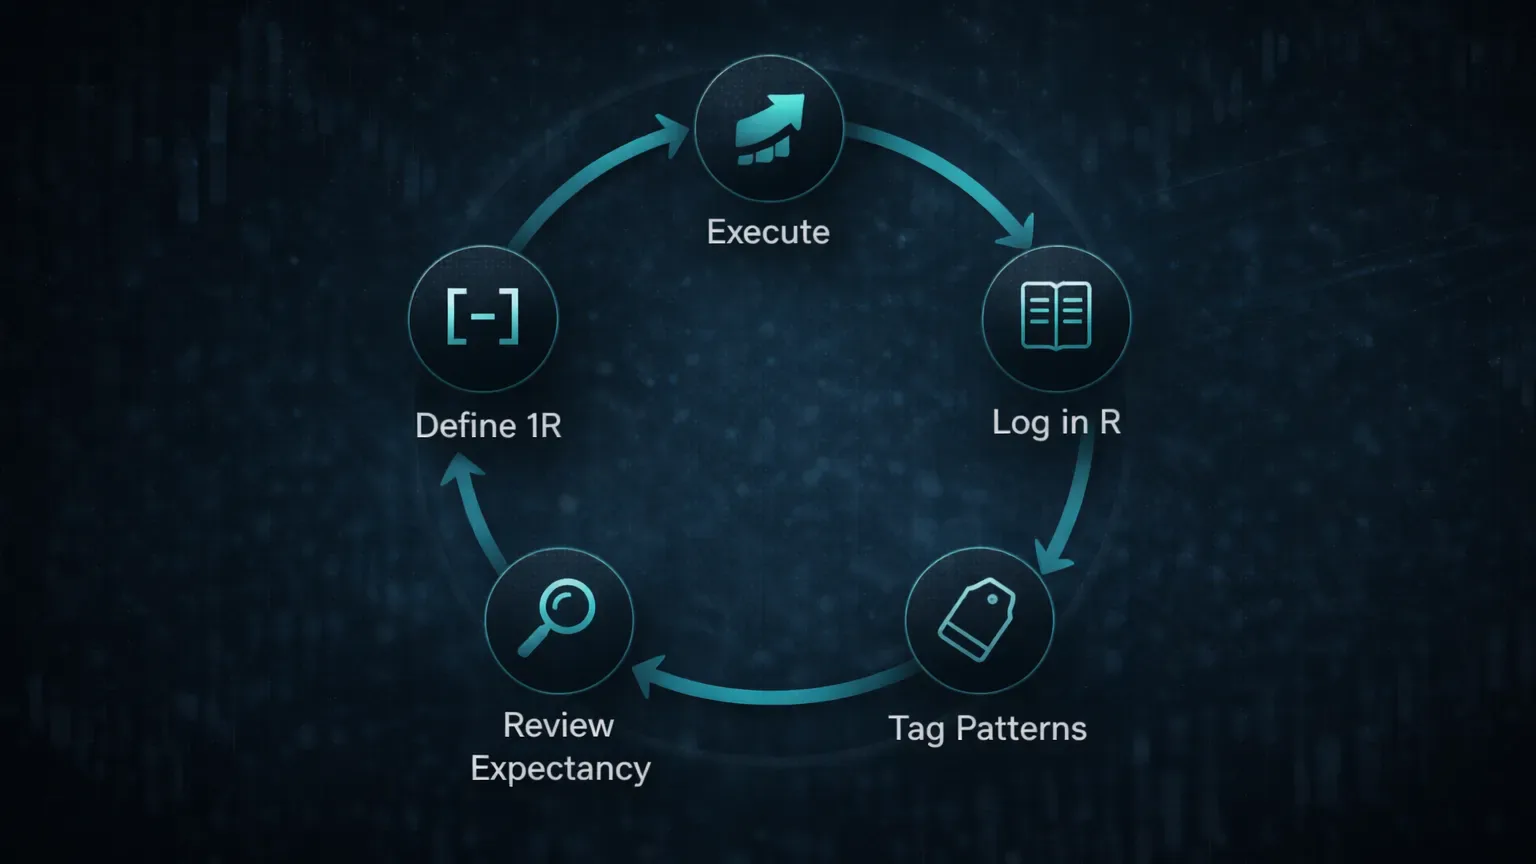
Turn This Into a Repeatable Journal Workflow
Understanding R-multiple is powerful. Actually using it inside your daily trading workflow is where the real edge develops. Numbers only matter when they shape behavior. A good crypto trading journal helps turn R-multiple theory into consistent review habits.
Start by tracking every trade in R, not just in dollars. Define your 1R risk per trade before you enter. Then log the final outcome of the trade as +R or −R. Over time, you will build an honest record of how your trades behave relative to the risk you chose to take.
Next, layer tagging on top. Tag trades by setup type, market condition, session, emotional state, or mistake category. When you review your analytics, you will start to see which combinations actually produce positive R and which ones consistently drain capital. It is common to discover that one or two setups carry the entire account while another tag quietly destroys expectancy.
You should also review average R and expectancy by session window. Many crypto traders perform significantly better during specific times of day. Outside those windows, fatigue and hesitation increase. R-multiple helps quantify that effect so you can align your trading time with when you perform best.
This is where a purpose-built crypto journal becomes more than a logbook. A platform like TradeChainly syncs trades automatically and calculates R outcomes, expectancy, win rate, and tag-level analytics without manual data entry. That saves time and removes friction, which means you are far more likely to review consistently rather than only when things go wrong.
The goal is simple. Build a workflow where R-multiple and expectancy become part of how you judge every strategy, session, and decision. When you see negative expectancy forming in the data, you adjust. When you see strong positive expectancy, you lean into it. That is how traders evolve from emotional decision making to data-driven improvement.
Win Rate or R-Multiple: Pick the Wrong One and You’ll Miss the Point
This is the part everyone wants a straight answer to. If you had to choose, which matters more for a crypto day trader: win rate or R-multiple?
The honest answer is that neither metric matters on its own. A trader with a 75 percent win rate can still be unprofitable. A trader winning only 40 percent of the time can grow their account steadily. The deciding factor is expectancy, which combines both metrics into one picture of real edge.
That said, different trading styles naturally lean toward different profiles.
Scalpers usually have higher win rates with smaller average R wins. They rely on precision, tight stops, and frequent small gains. Trend and momentum traders often accept a lower win rate in exchange for occasional large multi-R moves when the market really opens up. Both approaches can work. Both can fail if risk discipline breaks down.
What matters most is whether your average winning trade outweighs your average loss enough to stay net positive over a large sample of trades. Expectancy reveals that truth. Win rate alone cannot. R-multiple alone cannot.
So instead of chasing a specific win rate target, focus on building a trading process where losers stay near your planned -1R and your winners occasionally stretch to +2R, +3R, or more. Measure it. Track it over time. Let the numbers tell you if your approach is working.
Crypto is too volatile and too fast to trade based on emotion or ego. The market will humble any trader who values being right more than being profitable. Expectancy does not care how the win looked or how the loss felt. It only cares about the relationship between the two. And that relationship is what ultimately defines your trading performance.
Close With the Cost of Ignoring This
If there is one lesson to take from all of this, it is that win rate alone is a terrible way to judge your trading. You can win often and still bleed capital. You can lose frequently and still grow your account. What matters is the relationship between your average win and your average loss, expressed in R-multiple, and how those numbers combine into expectancy over time.
Crypto makes this even more important. Leverage, volatility, liquidation cascades, funding, and 24/7 market structure all distort raw PnL. R-multiple normalizes your results so you can see what is really happening beneath the noise.
A disciplined crypto trader focuses less on being right and more on protecting their risk profile. Keep losers near −1R. Allow winners the room to reach +2R, +3R, or more when the trade is working. Track the data. Review it honestly. Let expectancy tell you whether your edge is real or just hope wrapped in confidence.
This is where structured journaling becomes a force multiplier. A platform like TradeChainly helps automate the boring parts so you can focus on what matters: reviewing, tagging, and learning from every trade. Ignore these metrics long enough and you end up paying for it, usually in one oversized loss that wipes out weeks of “good” trading.